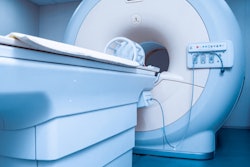
Ten years of MRI adverse event reports show burns from coils and electrocardiography (ECG) leads during scans are among the most common -- and preventable -- causes for patient injuries, according to a study presented on Thursday at the International Society for Magnetic Resonance in Medicine (ISMRM) meeting.
Researchers from the U.S. Food and Drug Administration (FDA) culled data from 2008 to 2017 and found that adverse thermal events that caused skin reddening, blisters, burns, and even fire and smoke accounted for 59% of all reports. Mechanical injuries (slips, falls, and broken bones) and errant projectiles rounded out the top three in the list of most-often cited reasons for accidents in the MRI suite.
"The majority of these events have known causes and are thus preventable," said Jana Delfino, PhD, from the FDA's Center for Drug Evaluation and Research (CDER). "Reducing the occurrence of these events is a shared responsibility among all of those working within the field of MR. Our shared safety goal should be to bring the preventable adverse event rate to zero."
Rather than provide a "comprehensive overview of MRI safety," Delfino and colleagues sought to use their review of adverse event reports "to increase awareness of the unique safety challenges inherent in the MR environment," she told ISMRM viewers.
The researchers tallied 1,568 adverse event reports, which came from MRI, PET/MRI, and nuclear MR spectroscopy systems, coils, and other components and accessories.
The reports were divided into the following categories:
- Thermal events that caused skin reddening, blisters, burns, warming, heating, fires, and smoke
- Acoustic events, which resulted in permanent or temporary hearing loss
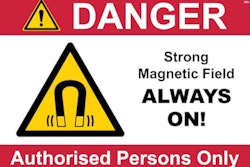
- Projectiles that were pulled into or attracted to the magnet
- Image quality issues, such as artifacts, image flipping, and lost results
- Mechanical events included slips, falls, broken bones, musculoskeletal injuries, and cuts
- Miscellaneous events, which were linked to the MRI system, but unrelated to the other categories
- An unclear classification for events with insufficient information to determine a definitive cause
Of the 1,568 reported adverse events, thermal causes topped the list with 906 cases (59%).
| Reasons for MRI adverse event reports | |
| Causes | No. of reports (%) |
| Thermal | 906 (59%) |
| Mechanical | 170 (11%) |
| Projectile | 133 (9%) |
| Miscellaneous | 109 (7%) |
| Image quality | 89 (6%) |
| Acoustic | 86 (6%) |
| Unclear | 44 (4%) |
| Total | 1,568 (100%) |
Among the adverse thermal reports, a definitive cause for 348 cases (39%) could not be determined. However, 257 submissions (28%) cited burns from contact with coils (54%), electrocardiography (ECG) electrodes or leads (15%), patient clothing (5%), stereotaxic head frames (4%), blankets (4%), orthopedic implants (3%), and tattoos/permanent makeup (2%) as the cause(s) for patient issues.
"A surprising finding of our analysis was that the MR coils were often cited as the likely cause of burn injuries, such as when coils were routed directly over the patient, patients were in contact with coil cables, or only when sheets or blankets were used to separate coil cables from the patient," Delfino told virtual attendees.
Of particular note were 97 injuries (10%) that occurred when large patients came in contact with the sides of the bore when they were positioned off-center for shoulder and breast exams, for example.
Among the 133 projectile events were 35 reports (26%) involving patient walkers, wheelchairs, stretchers, and chairs, 13 incidents (10%) with gas cylinders, 13 cases (10%) of magnet components exposed during servicing, 10 events (8%) with workmen's tools.
While the numbers provide some insight into the rate of adverse events and their causes in the MRI suite, Delfino cautioned that the results might not accurately reflect the degree of adverse events.
"The major limitation of this retrospective study is that the adverse events are derived from a passive reporting system," she added. "Therefore, information may be missing, inaccurate, or unverified, and the data cannot be used to determine the rates of adverse events."