A study presented at SERAM 2026 suggests that biparametric MRI (bpMRI) can detect clinically significant prostate cancer with diagnostic performance similar to conventional multiparametric MRI (mpMRI), while reducing examination time and costs.
Researchers led by Dr. María Elena Savino Ramos from Policlínica Metropolitana in Caracas, Venezuela, compared the two prostate MRI approaches in a retrospective cohort of patients who underwent MRI followed by targeted biopsy.
mpMRI is the standard imaging protocol for prostate cancer assessment and includes T2-weighted imaging, diffusion-weighted imaging (DWI), and dynamic contrast-enhanced (DCE) imaging. bpMRI omits DCE, which may simplify workflow and avoid gadolinium administration.
The investigators screened 1,017 patients evaluated for suspected prostate cancer between 2022 and 2025. The final analysis included 99 patients with 99 suspicious lesions who underwent cognitive targeted biopsy, with histopathology as the reference standard. Multiparametric prostate MRI showing a PI-RADS 5 lesion in a patient with Gleason 3+4 prostate cancer. Contrast-enhanced imaging did not alter lesion assessment.Courtesy of SERAM 2026
Three radiologists first interpreted the full mpMRI examinations and then re-read the studies without DCE to simulate a bpMRI protocol. In this cohort, bpMRI achieved sensitivity of 88%, specificity of 80%, positive predictive value of 93%, and overall accuracy of 86%. mpMRI showed sensitivity of 92%, specificity of 76%, positive predictive value of 92%, and accuracy of 70%.
Lower cost and acquisition time
The authors noted that mpMRI was slightly more sensitive, but bpMRI was more specific and more accurate in their dataset. They also reported that DCE did not alter PI-RADS assessment in the illustrative cases shown, consistent with evidence that the contrast-enhanced sequence adds limited value in many routine cases.
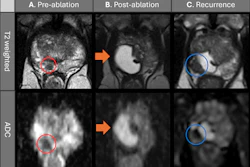
 Biparametric prostate MRI identified clinically significant Gleason 3+4 prostate cancer using T2-weighted imaging, diffusion-weighted imaging, and ADC mapping alone.Courtesy of SERAM 2026
Beyond diagnostic performance, bpMRI offered practical advantages. Eliminating DCE reduced acquisition time by about nine minutes and lowered costs by 30.56%.
The findings add to growing evidence that bpMRI may be sufficient for many patients undergoing prostate cancer evaluation, especially where scanner time and resources are limited.
The authors emphasized, however, that broader adoption should be supported by standardized protocols, quality assurance, and radiologist training. Larger prospective studies are still needed to confirm the results and define where bpMRI can safely replace mpMRI in clinical practice.