MRI scans have revealed the occurrence of placental contractions, which manifest in six out of 10 healthy pregnancies, researchers have reported.
These types of contractions are independent of the rest of the uterine wall, and characterizing them could help clinicians better understand the placenta's function, according to lead author Dr. Louise Dewick of the University of Nottingham in the U.K. Dewick's and colleagues' study was published 29 April in Plos One.
"This research is vital in furthering our understanding of exactly how the placenta works in pregnancy," Dewick said in a statement released by the journal. "[Our] work forms the basis of further studies on placental contractions and we hope will unlock even more knowledge about this complex but crucial organ."
Placental dysfunction is understood to be a major cause of pregnancy complications and stillbirth, but methods of monitoring the organ tend to be indirect, with a focus on fetal growth and activity. In 2020, University of Nottingham researchers using MR imaging identified contractions issuing from the placenta, but the basic characteristics of these contractions, whether they were indications of pregnancy complications, and how to distinguish them from uterine contractions remained unclear.
To address the knowledge gap, these investigators conducted a study that included 36 women between 29 and 42 weeks of pregnancy who underwent MR imaging. They used an automated neural network to analyze the MRI images and track changes in placental and uterine volume, area, and shape over time.
The team reported the following:
- Placental contractions occurred in at least 60% of these healthy pregnancies, with a median frequency of approximately two per hour and a median duration of 2.4 minutes.
- Compared to uterine contractions, placental contractions were more likely to change the shape of the placenta and lasted longer.
- All contractions, both placental and uterine, led to an increase in an MRI parameter linked to deoxygenated blood in the placenta.
Changes in the shape of the placenta -- specifically how spherical the placenta becomes -- could serve as a marker to automatically distinguish placental from uterine contractions.
The findings lay the groundwork for future studies of the placenta -- for example, investigating whether placental contractions differ in pregnancies complicated by conditions such as fetal growth restriction or preeclampsia, according to coauthor Prof. Penny Gowland, PhD.
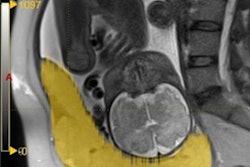
 Uterine and placental changes during an example placental contraction. The top row shows axial MRI images at selected times points before, during and after a placental contraction (indicated by vertical lines on the graph below) with segmentations shown below. Changes in placental and non-placental volumes, wall areas and placental R2* (all measured across the whole volume of the uterus, not just the single slice shown) are plotted underneath. The legend indicates the colors used for the lines in the plots and the regions indicated in the segmentation.Plos One
Access the full study here.