A deep-learning (DL) model used with MRI to analyze the composition of large muscles has shown that intermuscular fat and lean muscle mass are associated with high blood pressure and unhealthy lipid and blood sugar levels, researchers have reported.
The results suggest that MRI exams could "augment traditional risk factor screening," and "could help identify high-risk individuals who appear metabolically healthy by conventional standards for early intervention," noted lead author Sebastian Ziegelmayer, MD, of the Technical University of Munich in Germany, in an RSNA statement. The study findings were published May 5 in Radiology.
"Skeletal muscle is a major driver of metabolic health, influencing cardiovascular outcomes through multiple pathways, including glucose regulation, energy metabolism, and inflammatory responses, all of which influence cardiovascular health outcomes," he said.
Ziegelmayer and colleagues conducted a study that included 11,348 participants (56.9% men, median age 43) without any known preexisting conditions who underwent whole-body MRI at five imaging sites. They developed and used a segmentation algorithm to quantify the amount of intermuscular adipose tissue, or hidden fat, and functional muscle tissue in the paraspinal muscles along the spine between the neck and pelvis. In addition to the imaging exams, the team tracked participants' cardiometabolic risk factors through laboratory test results and clinical examinations; these results found previously undiagnosed conditions such as hypertension (16.2%), abnormal blood sugar (8.5%), and unhealthy lipid patterns (45.9%).
After adjusting for age, sex, physical activity, and study site, the team reported the following key findings:
- An increase in intermuscular adipose tissue was associated with a significantly higher odds ratio for high blood pressure (odds ratio, or OR, 1.67), abnormal blood sugar (OR, 0.51), and unhealthy lipid patterns (OR, 1.82) for both sexes.
- An increase in lean muscle mass was associated with a protective effect against cardiometabolic risk factors (high blood pressure [OR, 0.34], abnormal blood sugar [OR, 0.51], and unhealthy lipid patterns [OR, 0.49]), but only in men.
The study is a first step toward establishing an imaging-based biomarker that could identify patients who may be vulnerable to cardiometabolic issues, according to Ziegelmayer.
"With MRI, we can perform much more complex analysis if we extend this to more advanced sequences," he said. "Further exploring this direction holds considerable potential, as muscle composition may not only reflect cardiometabolic health, but health in general."
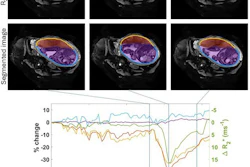
![Exemplary cases across four intermuscular adipose tissue (IMAT)–lean muscle mass (LMM) z score combinations. The figure shows four LMM-IMAT combinations in women (top row) and men (bottom row). From right to left, the panels show axial T2-weighted half-Fourier acquisition single-shot turbo spin-echo images of the thoracic and lumbar regions in individuals with high LMM and low IMAT and with low LMM and high IMAT. Participants were randomly selected from the highest or lowest quartile of each respective LMM-IMAT combination and were of similar age (44 years ± 2 [SD]) and body mass index in weight in kilograms divided by height in meters squared (21 ± 2). Segmentation masks for intermuscular fat and lean muscle are displayed in the top right corner of each region.](https://img.auntminnieeurope.com/mindful/smg/workspaces/default/uploads/2026/05/ziegelmayer.m0jOxvuI3P.jpg?auto=format%2Ccompress&dpr=2&fit=max&q=70&w=700) Exemplary cases across four intermuscular adipose tissue (IMAT)–lean muscle mass (LMM) z score combinations. The figure shows four LMM-IMAT combinations in women (top row) and men (bottom row). From right to left, the panels show axial T2-weighted half-Fourier acquisition single-shot turbo spin-echo images of the thoracic and lumbar regions in individuals with high LMM and low IMAT and with low LMM and high IMAT. Participants were randomly selected from the highest or lowest quartile of each respective LMM-IMAT combination and were of similar age (44 years ± 2 [SD]) and body mass index in weight in kilograms divided by height in meters squared (21 ± 2). Segmentation masks for intermuscular fat and lean muscle are displayed in the top right corner of each region.RSNA
Exemplary cases across four intermuscular adipose tissue (IMAT)–lean muscle mass (LMM) z score combinations. The figure shows four LMM-IMAT combinations in women (top row) and men (bottom row). From right to left, the panels show axial T2-weighted half-Fourier acquisition single-shot turbo spin-echo images of the thoracic and lumbar regions in individuals with high LMM and low IMAT and with low LMM and high IMAT. Participants were randomly selected from the highest or lowest quartile of each respective LMM-IMAT combination and were of similar age (44 years ± 2 [SD]) and body mass index in weight in kilograms divided by height in meters squared (21 ± 2). Segmentation masks for intermuscular fat and lean muscle are displayed in the top right corner of each region.RSNA
In an accompanying editorial, Houchun Harry Hu, PhD, of the Mayo Clinic in Jacksonville, FL, noted that the study provides "a compelling case supporting the role of MRI-based body composition profiling in epidemiologic studies," and that "by correlating quantitative imaging biomarkers of muscle with clinical and laboratory metrics, [it emphasizes] the potential for MRI to refine cardiometabolic risk stratification within the framework of preventive and precision medicine." And in another editorial, Bahram Mohajer, MD, and Waqas Bari, MD, both of the University of Pennsylvania in Philadelphia, wrote that "the findings … complement radiologic evidence that automated body composition metrics can improve risk stratification in asymptomatic populations."
Access the full study here.


![Overview of the study design. (A) The fully automated deep learning framework was developed to estimate body composition (BC) (defined as subcutaneous adipose tissue [SAT] in liters; visceral adipose tissue [VAT] in liters; skeletal muscle [SM] in liters; SM fat fraction [SMFF] as a percentage; and intramuscular adipose tissue [IMAT] in deciliters) from MRI. The fully automated framework comprised one model (model 1) to quantify different BC measures (SAT, VAT, SM, SMFF, and IMAT) as three-dimensional (3D) measures from whole-body MRI scans. The second model (model 2) was trained to identify standardized anatomic landmarks along the craniocaudal body axis (z coordinate field), which allowed for subdividing the whole-body measures into different subregions typically examined on clinical routine MRI scans (chest, abdomen, and pelvis). (B) BC was quantified from whole-body MRI in over 66,000 individuals from two large population-based cohort studies, the UK Biobank (UKB) (36,317 individuals) and the German National Cohort (NAKO) (30,291 individuals). Bar graphs show age distribution by sex and cohort. BMI = body mass index. (C) After the performance assessment of the fully automated framework, the change in BC measures, distributions, and profiles across age decades were investigated. Age-, sex-, and height-adjusted body composition reference curves were calculated and made publicly available in a web-based z-score calculator (https://circ-ml.github.io).](https://img.auntminnieeurope.com/mindful/smg/workspaces/default/uploads/2026/05/body-comp.XgAjTfPj1W.jpg?auto=format%2Ccompress&fit=crop&h=167&q=70&w=250)