As conventional MRI biomarkers for multiple sclerosis (MS) are nearing readiness for routine clinical use, advanced biomarkers are needed to overcome key limitations to these, according to research presented at ECR 2026.
Since their introduction in 2003, imaging biomarkers have been evolving, especially for MS, explained Dr. Yukio Miki, PhD, of Osaka Metropolitan University in Japan. In his talk, he discussed how MRI biomarkers will reshape MS management.
 Yukio Miki, MD, PhD.
MRI biomarkers are used in three ways: as outcome measures in clinical trials, for pathophysiological analyses, and for evaluating treatment response in individual patients.
Miki highlighted MS MRI biomarkers widely used as clinical trial endpoints. They include T2-lesion volume (depicting total lesion burden), gadolinium (Gd)-enhancing lesion count (indicating disease activity), brain atrophy (permanent tissue loss), T1 black-hole volume, and spinal cord atrophy.
"In the short-term, [T2-lesion volume] correlates poorly with disability," Miki said. However, over the long term, the association becomes much stronger, he added.
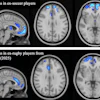
Brain atrophy is recognized as a strong marker, Miki noted. It progresses faster in MS and can be detected earlier in the disease. Deep gray-matter atrophy, especially thalamic atrophy, appears to be a more sensitive predictor of progression independent of relapse activity, he noted.
However, atrophied T2-lesion volume is a new MRI biomarker that reflects replacement of T2 lesions by cerebrospinal fluid (CSF) spaces (as brain tissue is lost through neurodegeneration, CSF spaces expand to fill the void).
"This is considered to be a robust MRI marker of multiple sclerosis disease progression and conversion into a secondary progressive disease course," Miki said.
Miki also homed in on chronic active lesions, such as the paramagnetic rim lesions detected on susceptibility-weighted imaging or quantitative susceptibility mapping, as well as slowly expanding lesions identified through longitudinal MRI analysis.
Both paramagnetic rim lesions and slowly expanding lesions are promising as they are strongly associated with long-term disability progression, Miki said.
AI-based volumetric tools have shown higher sensitivity for detecting new or enlarging lesions and may also facilitate paramagnetic rim lesion detection, according to Miki.
A systematic review of software available as of January 2023 found that 10 companies had released MS lesion analysis software. Of them, six had conducted technical validation, four had conducted clinical validation, and one had conducted an in-use evaluation. Those quantitative volumetric reporting tools received regulatory approval between 2006 and 2020, according to the review published in Neuroradiology.
Advanced quantitative MRI, however, aims to overcome the limitations of conventional MRI. Miki cited poor differentiation between demyelination, axonal loss, and edema, and the opportunity to quantify pathology in normal-appearing white matter, direct and indirect assessment of myelin content, iron deposition (chronic inflammation), and deeper insight overall into MS pathophysiology.
To that end, various methods have been proposed to quantify myelin alone, Miki explained. They include magnetization transfer imaging, myelin water imaging, myelin weighted imaging, T1 and T2 relaxometry, quantitative susceptibility mapping, and ultrashort echo time imaging.
"Most imaging measurements correlate well with histopathology for clinical disability," Miki added, noting that further work is needed to standardize and optimize the methodologies.
Also, glymphatic dysfunction in MS is gaining attention as a novel pathophysiological mechanism, according to Miki. "Glymphatic dysfunction may promote accumulation of proinflammatory molecules near venous walls," he said.
Ultimately, while there is a clinical need, advanced MRI biomarkers are not ready for routine clinical use. Looking ahead, AI may be a key enabler by translating complex MRI data into practical clinical decision support, Miki concluded.
Full coverage of ECR 2026 can be found here.