

A machine-learning algorithm and a risk stratification system called the Bone Tumor Imaging Reporting and Data System (BTI-RADS 2.0) produce accurate and standardized bone lesion assessment on CT and MR imaging, researchers have reported.
The findings could be good news for patients, noted a team led by Dr. Astrée Lemore, of the Université de Lorraine in Nancy, France. The findings were published on 22 April in Radiology.
"The differentiation between benign and malignant bone tumors is crucial for optimal patient management and has a major impact on the patient's prognosis," the researchers explained.
Standardized imaging evaluation of focal bone tumors is recommended, but no bone tumor reporting and data system versions currently available have gained "widespread acceptance or provided evidence to determine which imaging methods are required for optimal lesion characterization," Lemore and colleagues wrote.
To address this gap, they evaluated a machine learning-based approach for differentiating between benign and malignant bone lesions and proposed and assessed a risk stratification system.
The investigators conducted a trial that included 1,113 patients with solitary bone tumors who underwent either radiography or CT imaging and MR imaging at 10 centers between November 2009 and March 2022. Of the total patient cohort, 298 were in a training set and 815 were in a test set for the machine-learning algorithm. The group included 27 of 80 multimodal features for the training set. (The features included general ones such as demographic data, medical history, and tumor location, as well as clinical ones from x-ray, CT, and MR imaging.) The algorithm's findings were compared to those of 28 radiologist readers.
The team reported the following:
- The algorithm showed an F1 score of 0.81 (a measure of predictive performance, with 1 as reference. Its performance was slightly inferior to the radiologist readers, who demonstrated an F1 score of 0.83.
- BTI-RADS 2.0 risk calculator identified malignant lesions with a sensitivity of 96%.
It also found the following:
| BTI-RADS 2.0 performance for assessing bone lesions | |
|---|---|
| BTI-RADS 2.0 risk grade | Malignancy rate |
| II (likely benign) | 0% |
| III (suspicious for malignancy) | 8.3% |
| IV (likely malignant) | 45% |
| V (malignant) | 92% |
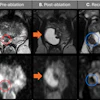
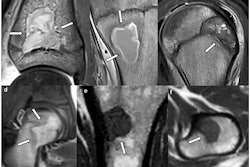
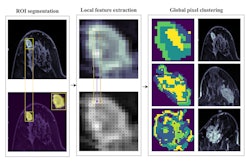
 A 47-year-old male patient with knee pain for 10 months. (A) Coronal T2-weighted fat-saturated and (B) axial T1-weighted fat-saturated post-gadolinium MRI scans show a lytic lesion of the proximal tibia with an irregular shape (arrowheads), soft tissue invasion (fat arrow in A), and perilesional bone marrow edema (*). (C) Coronal CT image reconstructed with bone kernels of the same lesion show permeative margins (arrows) and a discontinuous periosteal reaction (fat arrow). (D) Shapley additive explanations decision function graph shows the impact of lesion characteristics on the ensemble classifier’s prediction. After a one-hot encoding for categorical features, present features are represented as "(1)" and absent features as "(0)," whereas continuous features are represented by the actual measurement. The estimated malignancy probability of this lesion was 0.94, which corresponds to Bone Tumor Imaging Reporting and Data System grade V. This lesion corresponded to an undifferentiated sarcoma at histologic examination and was graded as aggressive by the human reader.Radiology
The research shows promise for improving bone lesion classification, wrote Dr. Michael Tordjman, of Icahn School of Medicine in New York City, and colleague Dr. Mark Murphey, of the American College of Radiology Institute for Radiologic Pathology in Silver Spring, MD, in an accompanying editorial.
"The study [demonstrates] that a novel machine learning-based algorithm can accurately classify solitary bone tumors by evaluating clinical and imaging features, helping direct patients with high risk of malignancy to referral centers for appropriate management by a multidisciplinary expert team," they concluded.
The complete study can be found here.


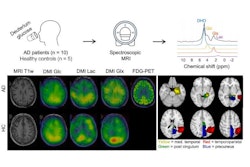


![Overview of the study design. (A) The fully automated deep learning framework was developed to estimate body composition (BC) (defined as subcutaneous adipose tissue [SAT] in liters; visceral adipose tissue [VAT] in liters; skeletal muscle [SM] in liters; SM fat fraction [SMFF] as a percentage; and intramuscular adipose tissue [IMAT] in deciliters) from MRI. The fully automated framework comprised one model (model 1) to quantify different BC measures (SAT, VAT, SM, SMFF, and IMAT) as three-dimensional (3D) measures from whole-body MRI scans. The second model (model 2) was trained to identify standardized anatomic landmarks along the craniocaudal body axis (z coordinate field), which allowed for subdividing the whole-body measures into different subregions typically examined on clinical routine MRI scans (chest, abdomen, and pelvis). (B) BC was quantified from whole-body MRI in over 66,000 individuals from two large population-based cohort studies, the UK Biobank (UKB) (36,317 individuals) and the German National Cohort (NAKO) (30,291 individuals). Bar graphs show age distribution by sex and cohort. BMI = body mass index. (C) After the performance assessment of the fully automated framework, the change in BC measures, distributions, and profiles across age decades were investigated. Age-, sex-, and height-adjusted body composition reference curves were calculated and made publicly available in a web-based z-score calculator (https://circ-ml.github.io).](https://img.auntminnieeurope.com/mindful/smg/workspaces/default/uploads/2026/05/body-comp.XgAjTfPj1W.jpg?auto=format%2Ccompress&dpr=2&fit=crop&h=167&q=70&w=250)