Philips has formed a new cardio-oncology partnership with U.S. cardiac MRI software developer, Myocardial Solutions.
The collaboration aims to improve survival rates and bridge a significant gap between heart and cancer care, Philips said. A combination of the MRI acquisition sequence Fast-SENC, the MyoStrain analysis tool, and Philips' SmartSpeed and BlueSeal technologies will be used to identify heart disease due to cardiotoxicity in cancer survivors and patients undergoing cancer therapies.
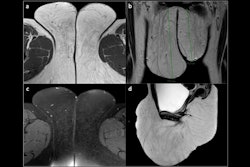
Philips said the technologies can detect heart failure across 48 segments of the heart in 10 minutes, with less than five minutes of analysis time to help identify regional dysfunction before it impacts the entire heart.
German researcher Prof. Dr. Sebastian Kelle from the German Heart Center and Charité University Medicine in Berlin will present his experience using the technologies during the Society for Cardiovascular Magnetic Resonance Annual Scientific Congress in Washington, DC.


![Overview of the study design. (A) The fully automated deep learning framework was developed to estimate body composition (BC) (defined as subcutaneous adipose tissue [SAT] in liters; visceral adipose tissue [VAT] in liters; skeletal muscle [SM] in liters; SM fat fraction [SMFF] as a percentage; and intramuscular adipose tissue [IMAT] in deciliters) from MRI. The fully automated framework comprised one model (model 1) to quantify different BC measures (SAT, VAT, SM, SMFF, and IMAT) as three-dimensional (3D) measures from whole-body MRI scans. The second model (model 2) was trained to identify standardized anatomic landmarks along the craniocaudal body axis (z coordinate field), which allowed for subdividing the whole-body measures into different subregions typically examined on clinical routine MRI scans (chest, abdomen, and pelvis). (B) BC was quantified from whole-body MRI in over 66,000 individuals from two large population-based cohort studies, the UK Biobank (UKB) (36,317 individuals) and the German National Cohort (NAKO) (30,291 individuals). Bar graphs show age distribution by sex and cohort. BMI = body mass index. (C) After the performance assessment of the fully automated framework, the change in BC measures, distributions, and profiles across age decades were investigated. Age-, sex-, and height-adjusted body composition reference curves were calculated and made publicly available in a web-based z-score calculator (https://circ-ml.github.io).](https://img.auntminnieeurope.com/mindful/smg/workspaces/default/uploads/2026/05/body-comp.XgAjTfPj1W.jpg?auto=format%2Ccompress&fit=crop&h=112&q=70&w=112)