As a critical step toward new therapies to aid the fight against diabetes and obesity, British researchers for the first time are using MRI to show the presence of brown adipose tissue in a living adult.
A new study from Warwick Medical School and University Hospitals Coventry and Warwickshire National Health Service (NHS) Trust, published in the Journal of Clinical Endocrinology and Metabolism (January 2014, Vol. 99:1, pp. E117–E121), outlines the benefits of MRI instead of PET to better detect and visualize so-called brown fat.
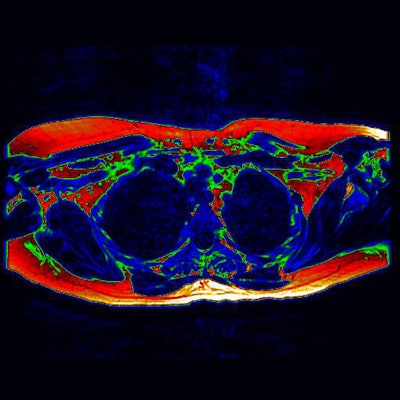
 The digitally enhanced axial MRI of the upper chest (as if viewed from the feet) shows area of potential brown fat (green). Image courtesy of the University of Warwick.
Brown fat has drawn the interests of researchers due its ability to use energy and burn calories, thus controlling weight.
There is the potential to develop safe and effective ways of activating brown fat to promote weight loss and increase energy expenditure, but more data are needed, according to study co-author Dr. Thomas Barber from the department of metabolic and vascular health at Warwick Medical School.
Unlike PET data, which only displays activity, MRI shows brown fat content whether active or not to provide detailed insight into where it can be found in the adult body. This information could prove vital in the creation of future therapies that seek to activate deposits of brown fat.