Adding dobutamine stress imaging during clinical cardiovascular MR (CMR) exams is feasible, according to U.K. research presented at the International Society for Magnetic Resonance in Medicine (ISMRM) 2025 meeting.
In her presentation, Dr. Rojda Ipek, from the Oxford Centre for Clinical Magnetic Resonance Research, discussed her team’s findings, showing that adding dobutamine stress imaging improves the ability of CMR to separate an athlete’s heart from early dilated cardiomyopathy (DCM).
“Taken together, the addition of dobutamine stress imaging during clinical CMR is a short, safe, and feasible add-on which markedly improves the ability of CMR …and may aid in optimal diagnostic and management strategies,” Ipek said.
Cardiac adaptations caused by exercise can present as left ventricular (LV) dilatation and mildly reduced LV ejection fraction (LVEF). This makes it important to differentiate an athletic heart from early DCM. The term “grey zone” is used in this instance, where clinical uncertainty raises the risk of misdiagnosis.
Cardiopulmonary exercise testing (CPET) is the go-to method for assessing patients in this area, but Ipek and colleagues noted its limitations, including barriers to access, being dependent on effort, and requiring a second specialist visit. The researchers determined whether adding stress imaging to CMR would improve the modality’s ability to separate athletic grey zones from early DCM grey zones.
The study included 71 participants who underwent rest and pharmacological-stress CMR using dobutamine to reach 65% of maximal heart rate. The participants also underwent CPET to be assessed for maximal oxygen consumption (VO2 max) as an indicator of aerobic capacity.
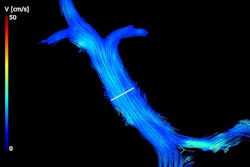
 Research presented at ISMRM 2025 found that adding dobutamine stress imaging to CMR can separate athletic hearts from hearts with early DCM. The stress CMR findings correlated well with CPET results, highlighting the feasability of adding dobutamine stress imaging to CMR exams.ISMRM
The team placed the participants into the following categories: healthy controls (n = 6, LVEF ≥ 56%), phenotype-positive DCM (n = 18, LVEF < 45% at time of diagnosis), and grey zone individuals.
For grey zone individuals, the team placed these participants into the following groups: mildly reduced LVEF, as grey zone athletes (n = 20, LVEF 45 to 63%), grey zone genotype-positive DCM (n = 6, EF 44 to 54%), and undifferentiated grey zone (n = 21, LVEF 44 to 56% with unknown cause).
When using CPET, the team found differences in LVEF between phenotype-positive DCM, healthy controls, and grey zone groups. However, it found no difference in cardiac output among the groups.
However, these groups separated during dobutamine stress, with grey zone athletes showing significantly higher cardiac output than phenotype-positive DCM and other grey zone individuals. Grey zone athletes put out 16.9 liters per minute (L/min) compared with the 10.3 L/min seen in phenotype-positive DCM patients. Grey zone genotype-positive DCM patients and participants with undifferentiated grey zones put out 12.2 L/min and 12.9 L/min, respectively (analysis of variance effect size, 0.318; p < 0.001).
And when the team used LV stroke volume indexed to weight (LVSVi), the groups separated more (analysis of variance effect size, 0.47; p < 0.001). Ipek noted that these stress CMR findings correlated well with CPET VO2 max (R2 = 0.57, p < 0.001).
When comparing grey zone groups only, stress LVSVi differentiated grey zone athletes from grey zone genotype-positive DCM and undifferentiated grey zone individuals. This included an area under the curve (AUC) of 0.86 (p < 0.0001), achieving a sensitivity of 90% and specificity of 74% at an LVSVi of 1.5 -ml/m2.
Ipek said that adding a brief stress protocol to CMR could help reliably attribute mildly reduced LVEF to athletic adaptation in grey zone athletes. This would rule out early DCM and reduce the need for CPET. She added that future research will determine whether stress LVSVi may further predict the development of heart failure.
Check out AuntMinnie’s full coverage of ISMRM 2025 in our RADCast.