Dear MRI Insider,
Can we get away without using contrast? This is often an acute dilemma for clinical staff when performing an MRI examination.
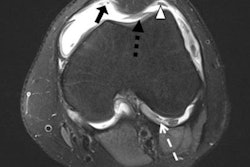
Researchers from Hannover Medical School, Germany, have addressed this issue in relation to juvenile idiopathic arthritis cases when using an augmented knee MRI protocol comprising proton density-weighted sequences. They published their findings this week in European Radiology. Find out more in our news report posted today.
As part of our news coverage of last week's RSNA meeting in Chicago, we conducted a video interview with Dr. Christiane Kuhl from Aachen, Germany, about the use of gadopiclenol as an alternative gadolinium-based MRI contrast agent. Don't miss this informative discussion with one of Europe's most respected investigators.
Also during the congress, the outcome of the "Images in Radiology" competition was unveiled, and MRI scans published by French and German teams were among the top prize winners. Get the full story in our article.
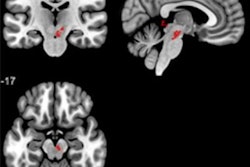
Another presentation at RSNA looked at how susceptibility-weighted MRI reveals that patients who have recovered from COVID-19 show changes in their brains up to six months later. Patients who had COVID-19 and recovered had higher susceptibility values on MRI in their frontal lobes and brain stems compared with the healthy controls.
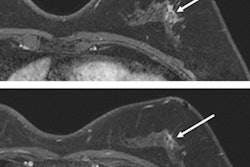
The football World Cup is approaching its final stages, and to mark the occasion, we published an article about award-winning Brazilian research into the optimum use of MRI in diagnosing goalkeepers' injuries of the hand and wrist.
In this letter, we've highlighted just a few of the many reports posted in the MRI Community over recent weeks. Please scroll through the full list below, and feel free to contact me if you have ideas for future coverage.


![Overview of the study design. (A) The fully automated deep learning framework was developed to estimate body composition (BC) (defined as subcutaneous adipose tissue [SAT] in liters; visceral adipose tissue [VAT] in liters; skeletal muscle [SM] in liters; SM fat fraction [SMFF] as a percentage; and intramuscular adipose tissue [IMAT] in deciliters) from MRI. The fully automated framework comprised one model (model 1) to quantify different BC measures (SAT, VAT, SM, SMFF, and IMAT) as three-dimensional (3D) measures from whole-body MRI scans. The second model (model 2) was trained to identify standardized anatomic landmarks along the craniocaudal body axis (z coordinate field), which allowed for subdividing the whole-body measures into different subregions typically examined on clinical routine MRI scans (chest, abdomen, and pelvis). (B) BC was quantified from whole-body MRI in over 66,000 individuals from two large population-based cohort studies, the UK Biobank (UKB) (36,317 individuals) and the German National Cohort (NAKO) (30,291 individuals). Bar graphs show age distribution by sex and cohort. BMI = body mass index. (C) After the performance assessment of the fully automated framework, the change in BC measures, distributions, and profiles across age decades were investigated. Age-, sex-, and height-adjusted body composition reference curves were calculated and made publicly available in a web-based z-score calculator (https://circ-ml.github.io).](https://img.auntminnieeurope.com/mindful/smg/workspaces/default/uploads/2026/05/body-comp.XgAjTfPj1W.jpg?auto=format%2Ccompress&fit=crop&h=100&q=70&w=100)


![Overview of the study design. (A) The fully automated deep learning framework was developed to estimate body composition (BC) (defined as subcutaneous adipose tissue [SAT] in liters; visceral adipose tissue [VAT] in liters; skeletal muscle [SM] in liters; SM fat fraction [SMFF] as a percentage; and intramuscular adipose tissue [IMAT] in deciliters) from MRI. The fully automated framework comprised one model (model 1) to quantify different BC measures (SAT, VAT, SM, SMFF, and IMAT) as three-dimensional (3D) measures from whole-body MRI scans. The second model (model 2) was trained to identify standardized anatomic landmarks along the craniocaudal body axis (z coordinate field), which allowed for subdividing the whole-body measures into different subregions typically examined on clinical routine MRI scans (chest, abdomen, and pelvis). (B) BC was quantified from whole-body MRI in over 66,000 individuals from two large population-based cohort studies, the UK Biobank (UKB) (36,317 individuals) and the German National Cohort (NAKO) (30,291 individuals). Bar graphs show age distribution by sex and cohort. BMI = body mass index. (C) After the performance assessment of the fully automated framework, the change in BC measures, distributions, and profiles across age decades were investigated. Age-, sex-, and height-adjusted body composition reference curves were calculated and made publicly available in a web-based z-score calculator (https://circ-ml.github.io).](https://img.auntminnieeurope.com/mindful/smg/workspaces/default/uploads/2026/05/body-comp.XgAjTfPj1W.jpg?auto=format%2Ccompress&fit=crop&h=112&q=70&w=112)


