
Dear AuntMinnieEurope Member,
CT colonography (CTC) training for radiographers is a relatively new phenomenon, but it is gathering pace. The CT Colonography School in Norway caters for both radiographers and radiologists; they do the whole course together, including theory-based lectures, cases, and practical training, and the school is attracting participants from across Scandinavia.
Four hands-on CTC courses for radiographers are being organized by St. Mark's Hospital in London in 2012, and its September and December week-long courses are already full.
But a Dutch study presented at this month's European Congress of Radiology (ECR) casts doubt on the cost-effectiveness of radiographers' contribution in this area. To read more, visit our CT Digital Community or click here.
MRI is great for evaluating cardiac transplant patients, but don't forget CT, warn Italian researchers. CT can provide useful inforation on end-diastolic volumes, end-systolic volumes, stroke volumes, cardiac output, and mass, and can be used for left ventricular assessment. Get the story here.
Belgian radiologists are showing the way when it comes to structured reporting, it seems. Led by Dr. Jan M. L. Bosmans, PhD, from Ghent, several radiologists have discussed the perceived benefits of these reports, as well as their concerns. Go to our Healthcare Informatics Digital Community or click here.
The potential future role of MR diffusion-weighted imaging and breast cancer management is attracting growing attention. European Radiology has just published an important article on this topic by authors from Turin, Italy. To find out more, click here.
The judges presented only six Magna Cum Laude awards to electronic poster exhibitors at ECR 2012. One of these prize winners was about peritoneal carcinomatosis, and you can read about it here.
Using computer-aided detection (CAD) as a preliminary reader in screening mammography can help to halve radiologists' workload, according to researchers from Jerusalem, who revealed their findings at ECR 2012. Visit our Advanced Visualization Digital Community or click here.

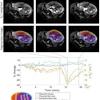
![Overview of the study design. (A) The fully automated deep learning framework was developed to estimate body composition (BC) (defined as subcutaneous adipose tissue [SAT] in liters; visceral adipose tissue [VAT] in liters; skeletal muscle [SM] in liters; SM fat fraction [SMFF] as a percentage; and intramuscular adipose tissue [IMAT] in deciliters) from MRI. The fully automated framework comprised one model (model 1) to quantify different BC measures (SAT, VAT, SM, SMFF, and IMAT) as three-dimensional (3D) measures from whole-body MRI scans. The second model (model 2) was trained to identify standardized anatomic landmarks along the craniocaudal body axis (z coordinate field), which allowed for subdividing the whole-body measures into different subregions typically examined on clinical routine MRI scans (chest, abdomen, and pelvis). (B) BC was quantified from whole-body MRI in over 66,000 individuals from two large population-based cohort studies, the UK Biobank (UKB) (36,317 individuals) and the German National Cohort (NAKO) (30,291 individuals). Bar graphs show age distribution by sex and cohort. BMI = body mass index. (C) After the performance assessment of the fully automated framework, the change in BC measures, distributions, and profiles across age decades were investigated. Age-, sex-, and height-adjusted body composition reference curves were calculated and made publicly available in a web-based z-score calculator (https://circ-ml.github.io).](https://img.auntminnieeurope.com/mindful/smg/workspaces/default/uploads/2026/05/body-comp.XgAjTfPj1W.jpg?auto=format%2Ccompress&fit=crop&h=100&q=70&w=100)


![Overview of the study design. (A) The fully automated deep learning framework was developed to estimate body composition (BC) (defined as subcutaneous adipose tissue [SAT] in liters; visceral adipose tissue [VAT] in liters; skeletal muscle [SM] in liters; SM fat fraction [SMFF] as a percentage; and intramuscular adipose tissue [IMAT] in deciliters) from MRI. The fully automated framework comprised one model (model 1) to quantify different BC measures (SAT, VAT, SM, SMFF, and IMAT) as three-dimensional (3D) measures from whole-body MRI scans. The second model (model 2) was trained to identify standardized anatomic landmarks along the craniocaudal body axis (z coordinate field), which allowed for subdividing the whole-body measures into different subregions typically examined on clinical routine MRI scans (chest, abdomen, and pelvis). (B) BC was quantified from whole-body MRI in over 66,000 individuals from two large population-based cohort studies, the UK Biobank (UKB) (36,317 individuals) and the German National Cohort (NAKO) (30,291 individuals). Bar graphs show age distribution by sex and cohort. BMI = body mass index. (C) After the performance assessment of the fully automated framework, the change in BC measures, distributions, and profiles across age decades were investigated. Age-, sex-, and height-adjusted body composition reference curves were calculated and made publicly available in a web-based z-score calculator (https://circ-ml.github.io).](https://img.auntminnieeurope.com/mindful/smg/workspaces/default/uploads/2026/05/body-comp.XgAjTfPj1W.jpg?auto=format%2Ccompress&dpr=2&fit=crop&h=167&q=70&w=250)


