Transition zone prostate-specific antigen (PSA) density outperforms conventional PSA density as a risk-stratification metric in detecting prostate cancer in patients with negative pre-biopsy MRI findings, according to a new study.
In an analysis published on 10 February in Insights into Imaging, researchers sought to establish the predictive efficacy of using transition zone PSA density (TZ-PSAD) in comparison with conventional PSA density (PSAD) for detecting clinically significant prostate cancer in patients with clinically significant prostate cancer not detected by prebiopsy MRI.
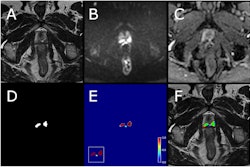
 Example of prostate zonal segmentation by the AI software in a patient. Yellow = transition zone; green = peripheral zone; red = anterior fibromuscular stroma; and blue = central zone.Shang et al; Insights into Imaging
As MRI can miss some clinically significant prostate cancer lesions, optimizing an approach for risk prediction and stratification in patients with suspected prostate cancer is a challenging yet essential need, pointed out Dr. Jiaheng Shang of the Department of Urology at Peking University First Hospital in Beijing and colleagues. PSA levels alone are not adequate for this task, as the authors have noted that benign prostatic hyperplasia (BPH) in the transition zone also commonly results in elevated PSA levels. This, combined with BPH frequently leading to an irregularly-shaped, asymmetrical transition zone, presents another challenge, often leading to unnecessary biopsies.
However, previous studies have shown that TZ-PSAD, calculated as the ratio of total PSA level to transition zone volume, is more effective than conventional PSAD in detecting clinically significant prostate cancer lesions not detected in imaging.
In a retrospective single-center study, the research team used AI software to automatically measure both prostate and zonal volumes and calculate PSAD and TZ-PSAD for 606 patients who underwent transrectal ultrasound-guided systematic biopsy after negative MRI imaging.
The AI system was used for accurate and reproducible segmentation and measurement of the prostate zones, the authors added.
The following four prostate zones were measured: transition zone volume (TZV), peripheral zone volume (PZV), central zone volume (CZV), and anterior fibromuscular stroma volume (AFSV).
Of the 606 patients, 51 (8.4%) were diagnosed with clinically-significant prostate cancer. Furthermore, patients with TZ-PSAD levels ≥ 0.35 ng/mL/cc were more likely to have clinically significant prostate cancer than those whose levels did not reach this threshold, with detection rates of 20.1% and 4.1%, respectively.
 Inclusion and exclusion flowchart of the study population. PSA = prostate-specific antigen; TRUS = transrectal ultrasound; BPH = benign prostatic hyperplasia.Shang et al; Insights into Imaging
The results showed that this TZ-PSAD threshold of 0.35 ng/mL/cc resulted in a higher number of true-positive and true-negative cases than the standard PSAD threshold of 0.2 ng/mL/cc; furthermore, it produced fewer false-positive and false-negative cases.
The sensitivity, specificity, positive predictive value, and negative predictive value of TZ-PSAD were all superior to those of PSAD, the authors concluded.
Moreover, multilevel risk stratification analysis showed that the detection rate of clinically-significant prostate cancer was 3.8% among patients under the TZ-PSAD threshold of 0.35 ng/mL/cc, well below the 10% biopsy-free threshold established by the European Association of Urology (EAU) -- meaning that biopsy can safely be avoided by these patients.
Combined with a higher detection rate (21.9%) of clinically-significant prostate cancer lesions in patients with TZ-PSAD levels above the threshold 0.35 ng/mL/cc, these findings suggest that TZ-PAD is superior to PSAD for risk stratification, the authors concluded -- in sensitivity, specificity, positive predictive value, and negative predictive value.
Read the study on the Insights into Imaging website.