Dear AuntMinnieEurope MRI Insider,
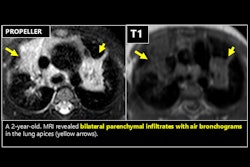
The controversial study published in JAMA Internal Medicine suggested that cancers associated with radiation from CT could eventually account for 5% of all new cases annually (see our article from 16 April). It seems likely this finding will add even more impetus to the greater use of MRI, especially in pediatric imaging.
In prize-winning work presented at ECR 2025, radiologists from Izmir, Turkey, shared their experiences of lung MRI in children. You can find out more in today’s top story.
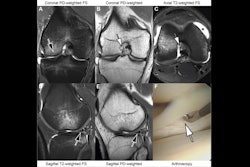
When it comes to the noninvasive diagnosis of acute and chronic knee abnormalities, MRI is the gold standard. There’s a strong push right now toward shorter examination times, and deep learning can help in this regard, according to research published on 23 April.
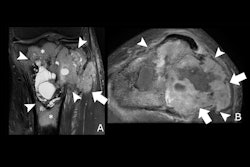
In other musculoskeletal news, French authors have reported that a machine-learning algorithm and a risk stratification system called the Bone Tumor Imaging Reporting and Data System (BTI-RADS 2.0) can produce accurate and standardized bone lesion assessment on MRI, as well as on CT.
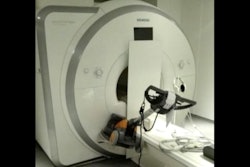
Our most viewed article in April was about a recent MRI accident in Finland. We hope to have a follow-up article on this incident soon. A timely two-day seminar on MRI safety will begin in Helsinki on 30 September. Dr. Tobias Gilk will lead the meeting, and you can read more about it on the organizer’s website. Such educational initiatives have a key role to play in preventing future accidents.
Finally, a breast research group has developed a nomogram that combined intratumoral heterogeneity scoring and clinicopathologic variables. Its study highlighted the nomogram’s high-achieving performance in predicting pathologic complete response to neoadjuvant chemotherapy and recurrence-free survival.
Philip Ward
Editor in Chief
AuntMinnieEurope.com


![Overview of the study design. (A) The fully automated deep learning framework was developed to estimate body composition (BC) (defined as subcutaneous adipose tissue [SAT] in liters; visceral adipose tissue [VAT] in liters; skeletal muscle [SM] in liters; SM fat fraction [SMFF] as a percentage; and intramuscular adipose tissue [IMAT] in deciliters) from MRI. The fully automated framework comprised one model (model 1) to quantify different BC measures (SAT, VAT, SM, SMFF, and IMAT) as three-dimensional (3D) measures from whole-body MRI scans. The second model (model 2) was trained to identify standardized anatomic landmarks along the craniocaudal body axis (z coordinate field), which allowed for subdividing the whole-body measures into different subregions typically examined on clinical routine MRI scans (chest, abdomen, and pelvis). (B) BC was quantified from whole-body MRI in over 66,000 individuals from two large population-based cohort studies, the UK Biobank (UKB) (36,317 individuals) and the German National Cohort (NAKO) (30,291 individuals). Bar graphs show age distribution by sex and cohort. BMI = body mass index. (C) After the performance assessment of the fully automated framework, the change in BC measures, distributions, and profiles across age decades were investigated. Age-, sex-, and height-adjusted body composition reference curves were calculated and made publicly available in a web-based z-score calculator (https://circ-ml.github.io).](https://img.auntminnieeurope.com/mindful/smg/workspaces/default/uploads/2026/05/body-comp.XgAjTfPj1W.jpg?auto=format%2Ccompress&fit=crop&h=100&q=70&w=100)


![Overview of the study design. (A) The fully automated deep learning framework was developed to estimate body composition (BC) (defined as subcutaneous adipose tissue [SAT] in liters; visceral adipose tissue [VAT] in liters; skeletal muscle [SM] in liters; SM fat fraction [SMFF] as a percentage; and intramuscular adipose tissue [IMAT] in deciliters) from MRI. The fully automated framework comprised one model (model 1) to quantify different BC measures (SAT, VAT, SM, SMFF, and IMAT) as three-dimensional (3D) measures from whole-body MRI scans. The second model (model 2) was trained to identify standardized anatomic landmarks along the craniocaudal body axis (z coordinate field), which allowed for subdividing the whole-body measures into different subregions typically examined on clinical routine MRI scans (chest, abdomen, and pelvis). (B) BC was quantified from whole-body MRI in over 66,000 individuals from two large population-based cohort studies, the UK Biobank (UKB) (36,317 individuals) and the German National Cohort (NAKO) (30,291 individuals). Bar graphs show age distribution by sex and cohort. BMI = body mass index. (C) After the performance assessment of the fully automated framework, the change in BC measures, distributions, and profiles across age decades were investigated. Age-, sex-, and height-adjusted body composition reference curves were calculated and made publicly available in a web-based z-score calculator (https://circ-ml.github.io).](https://img.auntminnieeurope.com/mindful/smg/workspaces/default/uploads/2026/05/body-comp.XgAjTfPj1W.jpg?auto=format%2Ccompress&fit=crop&h=112&q=70&w=112)


