Dear MRI Insider,
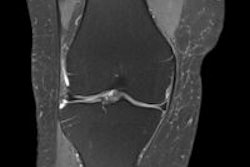
When evaluating knee MRI studies, studying the meniscus should be the first step because of the importance and prevalence of meniscal pathology. That was one of several key recommendations made by researchers from Pamplona, Spain, who received one of the three top awards for e-posters at the annual meeting of the European Society of Musculoskeletal Radiology in Riga, Latvia.
In their analysis, the researchers explained precisely how to read knee MRI examinations and their guidance may be of particular value for newcomers to the field. Go to your MRI Digital Community, or click here to read more.
New data about MRI waiting times in France were released earlier this month, and they don't make easy reading for the country's health authorities and managers. One highly respected senior radiologist believes the figures from Cemka-Eval highlight a disaster. Get the story here.
Extensive use is being made of MRI at the Commonwealth Games, a large sporting event currently taking place in Glasgow, U.K. More than 6,500 athletes and officials from Australia, Canada, India, South Africa, U.K., and other nations are participating in the games. To find out more about the polyclinic, click here.
The development of 7-tesla MRI continues to attract interest. At the joint meeting of the International Society for MR in Medicine and European Society for MR in Medicine and Biology in Milan, a desk-sized scanner was on display that reportedly can provide enhanced soft-tissue contrast and molecular imaging capability. Click here to learn more.
A fascinating report about MRI usage in the Republic of Ireland was published this month. You can get the full details here.
This letter features a small selection of the many articles posted in the MRI Digital Community. Check out the rest of our coverage below this message.


![Overview of the study design. (A) The fully automated deep learning framework was developed to estimate body composition (BC) (defined as subcutaneous adipose tissue [SAT] in liters; visceral adipose tissue [VAT] in liters; skeletal muscle [SM] in liters; SM fat fraction [SMFF] as a percentage; and intramuscular adipose tissue [IMAT] in deciliters) from MRI. The fully automated framework comprised one model (model 1) to quantify different BC measures (SAT, VAT, SM, SMFF, and IMAT) as three-dimensional (3D) measures from whole-body MRI scans. The second model (model 2) was trained to identify standardized anatomic landmarks along the craniocaudal body axis (z coordinate field), which allowed for subdividing the whole-body measures into different subregions typically examined on clinical routine MRI scans (chest, abdomen, and pelvis). (B) BC was quantified from whole-body MRI in over 66,000 individuals from two large population-based cohort studies, the UK Biobank (UKB) (36,317 individuals) and the German National Cohort (NAKO) (30,291 individuals). Bar graphs show age distribution by sex and cohort. BMI = body mass index. (C) After the performance assessment of the fully automated framework, the change in BC measures, distributions, and profiles across age decades were investigated. Age-, sex-, and height-adjusted body composition reference curves were calculated and made publicly available in a web-based z-score calculator (https://circ-ml.github.io).](https://img.auntminnieeurope.com/mindful/smg/workspaces/default/uploads/2026/05/body-comp.XgAjTfPj1W.jpg?auto=format%2Ccompress&fit=crop&h=100&q=70&w=100)


![Overview of the study design. (A) The fully automated deep learning framework was developed to estimate body composition (BC) (defined as subcutaneous adipose tissue [SAT] in liters; visceral adipose tissue [VAT] in liters; skeletal muscle [SM] in liters; SM fat fraction [SMFF] as a percentage; and intramuscular adipose tissue [IMAT] in deciliters) from MRI. The fully automated framework comprised one model (model 1) to quantify different BC measures (SAT, VAT, SM, SMFF, and IMAT) as three-dimensional (3D) measures from whole-body MRI scans. The second model (model 2) was trained to identify standardized anatomic landmarks along the craniocaudal body axis (z coordinate field), which allowed for subdividing the whole-body measures into different subregions typically examined on clinical routine MRI scans (chest, abdomen, and pelvis). (B) BC was quantified from whole-body MRI in over 66,000 individuals from two large population-based cohort studies, the UK Biobank (UKB) (36,317 individuals) and the German National Cohort (NAKO) (30,291 individuals). Bar graphs show age distribution by sex and cohort. BMI = body mass index. (C) After the performance assessment of the fully automated framework, the change in BC measures, distributions, and profiles across age decades were investigated. Age-, sex-, and height-adjusted body composition reference curves were calculated and made publicly available in a web-based z-score calculator (https://circ-ml.github.io).](https://img.auntminnieeurope.com/mindful/smg/workspaces/default/uploads/2026/05/body-comp.XgAjTfPj1W.jpg?auto=format%2Ccompress&fit=crop&h=112&q=70&w=112)


