A 25% reduced dose of gadobutrol for contrast-enhanced brain MRI is "noninferior" to a standard dose of gadoterate, according to a study published on 17 June in the American Journal of Roentgenology.
The results could reduce contrast dose exposure in patients who undergo multiple exams with gadolinium-based contrast agents, said study corresponding author Dr. Jan Endrikat, PhD, of the University Medical School of Saarland in Germany in a statement released by the American Roentgen Ray Society (ARRS).
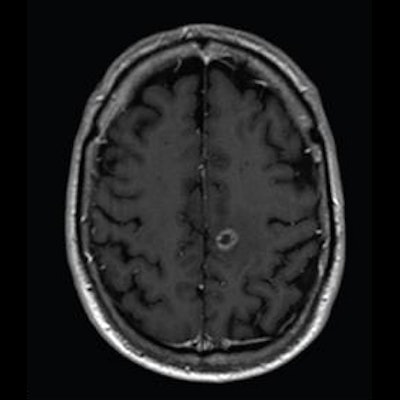
 Axial T1-weighted MR images obtained using (A) standard-dose gadoterate and (B) reduced-dose gadobutrol four days later. Mean score across three readers for standard-dose gadoterate and reduced-dose gadobutrol was 3.4 and 3.4, respectively, for subjective lesion enhancement; 3.5 and 3.4, respectively, for lesion border delineation; and 2.9 and 2.9, respectively, for lesion internal morphology. Image and caption courtesy of the ARRS.
The study included 141 patients with known or suspected central nervous system conditions who underwent contrast-enhanced brain MRI with standard-dose gadoterate (0.1 mmol/kg); if a lesion was found, the patients underwent a second MRI with reduced-dose gadobutrol (0.075 mmol/kg) within 15 days.
"Comparison of reduced-dose gadobutrol and standard-dose gadoterate versus unenhanced imaging demonstrated noninferiority using 20% margin for three primary efficacy measures: subjective lesion enhancement, lesion border delineation, lesion internal morphology," the ARRS said.