Cardiac imaging guru Dr. Stephan Achenbach from Erlangen, Germany, contributed one of the daily quizzes posted by the European Society of Cardiology (ESC) during this week's annual congress in Barcelona, Spain. Achenbach was chair of the congress program committee at ESC 2017, which concluded on 30 August.
Members of the European Association of Cardiovascular Imaging (EACVI) created the short quizzes. Below, you can test yourself to see if you can give the correct diagnosis in all four cases.
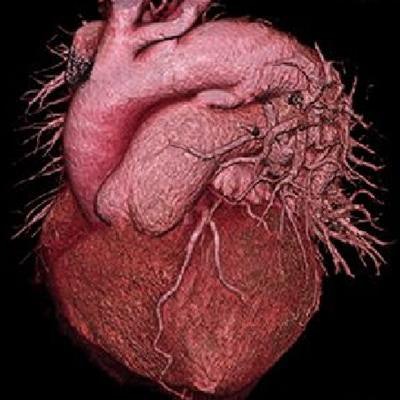
Quiz 1

Three-dimensional CT angiography of the heart in a 53-year-old patient with shortness of breath.
By Dr. Stephan Achenbach, Friedrich-Alexander, University Erlangen-Nürnberg, Germany.
Click here for the answer.
Quiz 2

A 67-year-old male patient was referred for assessment of viability following recent acute myocardial infarction. A still frame of a midventricular short-axis cine (left) and a late gadolinium-enhanced MRI scan in the same orientation (right) are shown.
By Drs. Sebastian Onciul and Sven Plein, University of Leeds, U.K.
Click here for the answer.
Quiz 3

Cardiac late-enhancement MR image in an 80-year-old female with shortness of breath, concentric left ventricular hypertrophy and severe diastolic dysfunction.
By Dr. Chiara Bucciarelli-Ducci, University of Bristol, U.K.
Click here for the answer.
Quiz 4

Transthoracic echocardiography (modified four-chamber view) in a 42-year-old female with atypical chest pain and stress electrocardiogram (ECG), suggesting myocardial ischemia. The arrow points at an unusual structure in the right ventricle.
By Drs. Bogdan Popescu and Roxana Enache, University of Medicine and Pharmacy "Carol Davila" - Euroecolab, Institute of Cardiovascular Diseases "Prof. Dr. C. C. Iliescu," Bucharest, Romania.
Click here for the answer.