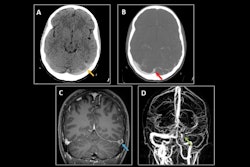
Predictors for acute conditions such as stroke could make brain MRI a better choice in patients who present in the emergency department with dizziness or vertigo, according to research published on 11 April in the American Journal of Neuroradiology.
A team led by Tatu Happonen, MD, of the University of Turku in Finland found that factors such as older age, male sex, cardiovascular risk level, and particular neurologic signs appear to help clinicians better determine whether a patient could benefit from MR imaging -- thus reducing unnecessary exams.
"Acute dizziness and vertigo remain challenging even when emergency MR imaging is readily available," the group noted. "[Our study found that only] one in four patients had acute pathology on MR imaging … [but] predictors for acute pathology (older age, male sex, cardiovascular risk factors, and neurologic signs) may aid in patient selection for MR imaging, optimizing the yield and clinical impact of emergency neuroimaging."
"Patients exhibiting acute dizziness or vertigo often represent a diagnostic challenge," Happonen and colleagues noted. "Despite many patients being diagnosed with a benign peripheral vestibular disorder, some patients may need neuroimaging to rule out central causes of dizziness … [but] stroke, particularly vertebrobasilar acute ischemic stroke, is the primary differential diagnosis among central causes and is diagnosed in [only] … 3% to 5% of all emergency visits for dizziness and vertigo."
Happonen and colleagues sought to assess imaging outcomes of emergency MR exams among patients with acute dizziness or vertigo in an effort to identify any clinical risk factors for stroke and other acute pathology. Their study included 1,169 individuals who underwent emergency MR imaging prompted by dizziness or vertigo over a five-year period. The group analyzed patient characteristics, relevant clinical information, and imaging outcomes.
The investigators reported that acute stroke was found in only 17% of the study cohort, and other clinically significant pathology in only 8%. In fact, in 75% of patients, MR imaging showed no significant abnormalities, they reported. On its own, dizziness had no identifying power on imaging outcomes, with only 14% of patients with the symptom showing acute stroke. The group also noted that risk scores had only "moderate performance" for predicting stroke, with a receiver operating characteristic area under curve (AUC) of 0.75.
But among those diagnosed with acute stroke, there were risk factors that indicated its presence, including aphasia/dysarthria, ataxia, old cerebral infarction, auditory symptoms, inpatient hospitalization status, diplopia, nausea/vomiting, age older than 55 years, male sex, and absence of vertigo.
Whether to use MRI among emergency department patients presenting with dizziness remains a sticky clinical issue, according to the authors.
"Although the rate of nonsignificant pathology may seem too high (75%), ruling out infarctions with high sensitivity in these patients is likely valuable for them and their physicians," they concluded.
The complete study can be found here.


![Overview of the study design. (A) The fully automated deep learning framework was developed to estimate body composition (BC) (defined as subcutaneous adipose tissue [SAT] in liters; visceral adipose tissue [VAT] in liters; skeletal muscle [SM] in liters; SM fat fraction [SMFF] as a percentage; and intramuscular adipose tissue [IMAT] in deciliters) from MRI. The fully automated framework comprised one model (model 1) to quantify different BC measures (SAT, VAT, SM, SMFF, and IMAT) as three-dimensional (3D) measures from whole-body MRI scans. The second model (model 2) was trained to identify standardized anatomic landmarks along the craniocaudal body axis (z coordinate field), which allowed for subdividing the whole-body measures into different subregions typically examined on clinical routine MRI scans (chest, abdomen, and pelvis). (B) BC was quantified from whole-body MRI in over 66,000 individuals from two large population-based cohort studies, the UK Biobank (UKB) (36,317 individuals) and the German National Cohort (NAKO) (30,291 individuals). Bar graphs show age distribution by sex and cohort. BMI = body mass index. (C) After the performance assessment of the fully automated framework, the change in BC measures, distributions, and profiles across age decades were investigated. Age-, sex-, and height-adjusted body composition reference curves were calculated and made publicly available in a web-based z-score calculator (https://circ-ml.github.io).](https://img.auntminnieeurope.com/mindful/smg/workspaces/default/uploads/2026/05/body-comp.XgAjTfPj1W.jpg?auto=format%2Ccompress&fit=crop&h=100&q=70&w=100)


![Overview of the study design. (A) The fully automated deep learning framework was developed to estimate body composition (BC) (defined as subcutaneous adipose tissue [SAT] in liters; visceral adipose tissue [VAT] in liters; skeletal muscle [SM] in liters; SM fat fraction [SMFF] as a percentage; and intramuscular adipose tissue [IMAT] in deciliters) from MRI. The fully automated framework comprised one model (model 1) to quantify different BC measures (SAT, VAT, SM, SMFF, and IMAT) as three-dimensional (3D) measures from whole-body MRI scans. The second model (model 2) was trained to identify standardized anatomic landmarks along the craniocaudal body axis (z coordinate field), which allowed for subdividing the whole-body measures into different subregions typically examined on clinical routine MRI scans (chest, abdomen, and pelvis). (B) BC was quantified from whole-body MRI in over 66,000 individuals from two large population-based cohort studies, the UK Biobank (UKB) (36,317 individuals) and the German National Cohort (NAKO) (30,291 individuals). Bar graphs show age distribution by sex and cohort. BMI = body mass index. (C) After the performance assessment of the fully automated framework, the change in BC measures, distributions, and profiles across age decades were investigated. Age-, sex-, and height-adjusted body composition reference curves were calculated and made publicly available in a web-based z-score calculator (https://circ-ml.github.io).](https://img.auntminnieeurope.com/mindful/smg/workspaces/default/uploads/2026/05/body-comp.XgAjTfPj1W.jpg?auto=format%2Ccompress&fit=crop&h=112&q=70&w=112)


