
Dear MRI Insider,
The ECR's electronic poster exhibition, or EPOS, is always well worth a close look. Often there's a hidden gem to be found there.
In an article published today, we've focused on a practical and timely e-poster from Spain that received a cum laude award at this month's congress. The poster is about the optimum use of MRI in rectal cancer, and in addition to sharing their clinical knowledge and experiences with you, the authors have kindly agreed to let us reproduce three informative figures from their exhibit.
Thanks to artificial intelligence algorithms, many MRI artifacts are now automatically corrected during the image acquisition phase or on the acquired signal, but it's still important to keep aware of artifacts, say researchers from France and Argentina who also collected an award for their ECR 2023 e-poster.
Whole-body MRI continues to show substantial promise as a viable alternative to lung cancer staging. Don't miss our news report about study findings in this area presented at the recent Vienna congress.
Prof. Dr. Christiane Kuhl, a valued and active member of our Editorial Advisory Board, was unable to make it to ECR 2023, but we caught up with her after the meeting to find out her thoughts on breast density and the MRI screening debate. We also checked in with Dr. Ritse Mann.
In other news, past ECR president Prof. Paul Parizel and his colleagues at Royal Perth Hospital in Australia have acquired a mobile ultralow-field MRI scanner. They've already started to explore how to use this technology in point-of-care settings such as the intensive care unit, the emergency department, mobile stroke units, and resource-limited locations.
This letter has highlighted just a few of the many reports posted in the MRI Community over recent weeks. Please scroll through the full list below, and feel free to contact me if you have ideas for future coverage.

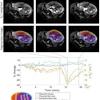
![Overview of the study design. (A) The fully automated deep learning framework was developed to estimate body composition (BC) (defined as subcutaneous adipose tissue [SAT] in liters; visceral adipose tissue [VAT] in liters; skeletal muscle [SM] in liters; SM fat fraction [SMFF] as a percentage; and intramuscular adipose tissue [IMAT] in deciliters) from MRI. The fully automated framework comprised one model (model 1) to quantify different BC measures (SAT, VAT, SM, SMFF, and IMAT) as three-dimensional (3D) measures from whole-body MRI scans. The second model (model 2) was trained to identify standardized anatomic landmarks along the craniocaudal body axis (z coordinate field), which allowed for subdividing the whole-body measures into different subregions typically examined on clinical routine MRI scans (chest, abdomen, and pelvis). (B) BC was quantified from whole-body MRI in over 66,000 individuals from two large population-based cohort studies, the UK Biobank (UKB) (36,317 individuals) and the German National Cohort (NAKO) (30,291 individuals). Bar graphs show age distribution by sex and cohort. BMI = body mass index. (C) After the performance assessment of the fully automated framework, the change in BC measures, distributions, and profiles across age decades were investigated. Age-, sex-, and height-adjusted body composition reference curves were calculated and made publicly available in a web-based z-score calculator (https://circ-ml.github.io).](https://img.auntminnieeurope.com/mindful/smg/workspaces/default/uploads/2026/05/body-comp.XgAjTfPj1W.jpg?auto=format%2Ccompress&fit=crop&h=100&q=70&w=100)

![Overview of the study design. (A) The fully automated deep learning framework was developed to estimate body composition (BC) (defined as subcutaneous adipose tissue [SAT] in liters; visceral adipose tissue [VAT] in liters; skeletal muscle [SM] in liters; SM fat fraction [SMFF] as a percentage; and intramuscular adipose tissue [IMAT] in deciliters) from MRI. The fully automated framework comprised one model (model 1) to quantify different BC measures (SAT, VAT, SM, SMFF, and IMAT) as three-dimensional (3D) measures from whole-body MRI scans. The second model (model 2) was trained to identify standardized anatomic landmarks along the craniocaudal body axis (z coordinate field), which allowed for subdividing the whole-body measures into different subregions typically examined on clinical routine MRI scans (chest, abdomen, and pelvis). (B) BC was quantified from whole-body MRI in over 66,000 individuals from two large population-based cohort studies, the UK Biobank (UKB) (36,317 individuals) and the German National Cohort (NAKO) (30,291 individuals). Bar graphs show age distribution by sex and cohort. BMI = body mass index. (C) After the performance assessment of the fully automated framework, the change in BC measures, distributions, and profiles across age decades were investigated. Age-, sex-, and height-adjusted body composition reference curves were calculated and made publicly available in a web-based z-score calculator (https://circ-ml.github.io).](https://img.auntminnieeurope.com/mindful/smg/workspaces/default/uploads/2026/05/body-comp.XgAjTfPj1W.jpg?auto=format%2Ccompress&dpr=2&fit=crop&h=167&q=70&w=250)


