MRI has advantages over transvaginal ultrasound (TVUS) when characterizing adnexal lesions based on the Ovarian-Adnexal Imaging-Reporting-Data System (O-RADS), according to findings published on 27 October in the European Journal of Radiology.
A team led by Dr. Isabelle Thomassin-Naggara, PhD, from the Assistance Publique–Hôpitaux de Paris in France, found that MRI is on par with TVUS when it comes to sensitivity, but it has higher specificity.
“MRI should be the recommended second-line technique when a mass is discovered during TVUS and is rated O-RADS 4 and 5 over than TVUS by an ultrasound specialist,” the Thomassin-Naggara team wrote.
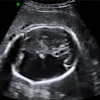
Accurate characterization of adnexal lesions is important for deciding the best course of action for treatment. TVUS is the first-line option in this area. The researchers pointed out that while both ultrasound and MRI can assess solid lesion components, solid tissues, and components can appear echoic on TVUS. MRI is typically the go-to modality when an adnexal lesion is considered “complex” or “indeterminate” on ultrasound.
The American College of Radiology’s (ACR) O-RADS scoring scale meanwhile aims to standardize the characterization of such lesions, with scores of 4 and 5 indicating intermediate and high risk of malignancy, respectively.
Thomassin-Naggara and co-authors wanted to investigate the diagnostic performance of O-RADS ultrasound performed by an expert sonographer and O-RADS MRI scores to find out for which lesions either modality should be recommended according to O-RADS.
They included data collected between 2013 and 2017 from 227 women who underwent both imaging methods. The women presented for characterization of an adnexal lesion proven by surgery or two years of negative follow-up. The researchers reported that the prevalence of malignancy was 11.1%.
The team found that while MRI and TVUS had the same sensitivity, MRI had a significant advantage when it came to specificity and accuracy.
| Comparison between TVUS, MRI for characterizing adnexal lesions based on O-RADS | |||
|---|---|---|---|
| O-RADS ultrasound | O-RADS MRI | p-value | |
| Sensitivity | 83.3% | 83.3% | N/A |
| Specificity | 73.2% | 92.2% | < 0.001 |
| Accuracy | 75.4% | 91.8% | < 0.001 |
The researchers also found that when MRI was used after ultrasound, 51 lesions were reclassified correctly by MRI while four lesions were incorrectly reclassified. They also reported that 49 of the lesions that were rated O-RADS ultrasound 4 or 5 and reclassified correctly by MRI were benign.
Finally, the team found that just four lesions were misclassified by MRI but correctly classified by ultrasound.
The study authors suggested that their results show that MRI should be considered for high-risk lesions and that MRI has the added benefit of being able to diagnose epithelial tumors. They pointed out that O-RADS ultrasound does not consider important morphological elements in tissue characterization for epithelial tumors.
“As the role of imaging techniques is to show the highest degree of certainty to be included in management decisions, pelvic MRI should also be recommended for mass rated O-RADS ultrasound 5 in the same time than CT scan for local staging,” the authors wrote.
The study can be found in its entirety here.