Dual-layer CT with high-contrast images demonstrates potential as a useful method for preoperative staging of breast cancer, according to research presented on 4 March at ECR 2023 in Vienna.
In his presentation, Bok Dong Yeo from Kyungpook National University Hospital in South Korea discussed his team's findings, which showed that by creating virtual monochromatic images at low energy use, dual-layer CT is comparable to breast MRI in this setting and has high agreement with pathology findings.
"Dual-layer breast CT is feasible to assess breast cancer extent for preoperative tumor staging with excellent agreement in tumor size compared to breast MRI," Yeo said.
MRI is considered the most sensitive modality when it comes to supplemental breast imaging, including in evaluating the extent of breast cancer prior to treatment. However, as Yeo noted, MRI is limited in availability, has higher cost, and has longer image acquisition times.
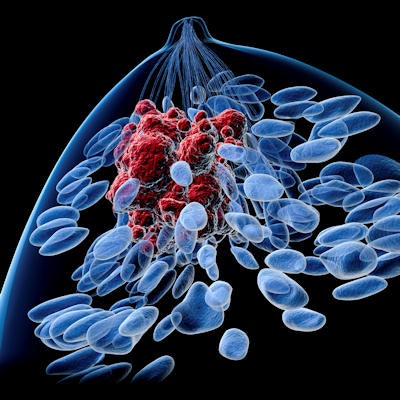
 Dok Bong Yeo from Kyungpook National University Hospital in South Korea presented his team's findings at ECR 2023, showing that dual-layer CT has high concordance with MRI when it comes to breast cancer staging. The images shown depict how this CT method also detects suspicious breast lesions prior to treatment in comparison to conventional MRI. Images courtesy of Dok Bong Yeo and the European Society of Radiology.
Dual-layer CT meanwhile creates virtual monochromatic images at different monochromatic x-ray energies from two different energy datasets. When at low kiloelectronvolts (keV), these images can increase contrast enhancement. Additionally, NAME said dual-layer CT can overcome increased image noise at low-energy levels with an anti-correlative filter, canceling out scattering and photoelectric effects.
Yeo and colleagues wanted to test dual-layer CT's feasibility in breast cancer staging as well as compare it with conventional MRI and pathology findings. They gathered data from 152 women with an average age of 51.5 years who had a total of 155 breast lesions. Out of the lesions found, 121 were invasive ductal carcinoma, 10 were ductal carcinoma in situ (DCIS), and the remaining 14 were labeled "others."
On dual-layer CT, the team acquired virtual monochromatic images with 40 keV and reconstructed them into 3D images. The CT images were reviewed by radiologists first, and then after a month, MR images were reviewed independently to reduce memory bias.
The researchers found that dual-layer CT showed high correlation and agreement with MRI pathology findings, including through correlation measurements and tumor sizing.
| Comparison between dual-layer CT, breast MRI, and pathology findings | |||
| MRI vs. Pathology | Dual-CT vs. Pathology | Dual-layer CT vs. MRI | |
| Tumor size difference (cm) | -0.04 | +0.08 | +0.12 |
| Pearson's correlation coefficient | 0.8354 | 0.8352 | 0.8414 |
| Intraclass correlation coefficient | 0.839 | 0.817 | 0.810 |
The correlation between CT and MRI results was statistically significant (p < 0.001). Yeo said their study shows that dual-layer breast CT can be used as an alternative for cancer staging when breast MRI is not available.


