Thoracic CT is showing promise as an imaging examination that can help clinicians monitor the health of obese patients, according to research from a leading London facility delivered on 5 March at ECR 2021.
In a session that addressed the use of imaging for visualizing obesity, Dr. Susan Copley of Imperial College Healthcare NHS Trust London shared clinical results that highlight the key role CT could play in monitoring the risk of cardiovascular disease in obese patients.
The World Health Organization defines obese individuals as those having a body mass index over 30 kg/m2, and it warns that being obese is a major risk factor for diabetes, cardiovascular disease, and cancer, Copley said. The prevalence of obesity is increasing worldwide; in the U.K. in 2018, 28% of the adult population had a BMI greater than 30, she noted.
And the condition has come into sharp focus during the COVID-19 pandemic, as obesity's effects on the lungs increase the risk that those with COVID-19 could die from the illness -- likely due to higher levels of inflammatory cytokines and lower levels of adiponectin, a hormone that protects the lungs from injury, in obese people.
"A BMI of 35 to 40 increases a COVID-19 patient's risk of dying by 40%," Copley said. "A BMI of more than 40 increases that risk to 90%."
She referred to a study she and colleagues conducted in 2016 that was published in European Radiology that tracked 296 patients who underwent CT pulmonary angiography (CTPA) for pulmonary embolism. The study found that the shape and area of the posterior tracheal wall correlated with increasing subcutaneous fat thickness.
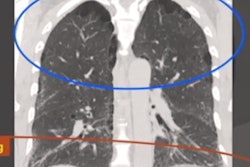
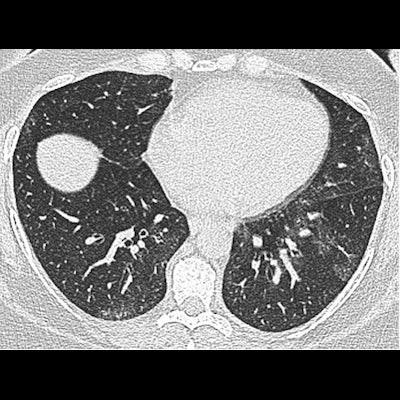
 Axial unenhanced inspiratory CT images of the lungs of a 51-year-old woman before (a) and six months after (b) bariatric surgery that led to a 31-kg (68 pounds, or nearly five stone) weight loss (body mass index fell to 36.1). The mosaic attenuation seen before surgery was resolved after surgery. (Images courtesy of Dr. Susan Copley and Radiology).
Copley also referred to a study she and a team conducted last year that was published in Radiology that used CT to assess lung parenchymal and tracheal morphology before and six months after patients underwent bariatric surgery. This investigation showed that particular imaging abnormalities improved after patients lost weight.
| Imaging features in obese patients before and after bariatric surgery | ||
| Imaging feature | Before surgery | 6 months after surgery |
| Mosaic attenuation | 33.3% | 13.7% |
| End-expiratory air trapping | 92.2% | 29.4% |
| Tracheal area | 201 mm2 | 229 mm2 |
"CT extent of air trapping correlates most with decreased lung capacity in obese people, [and improvement in] air trapping was the main determinant for decreased dyspnea following surgery," she said.
Bariatric surgery and weight loss appear to reverse some of the negative effects of obesity on the respiratory system, Copley noted. CT has great potential to improve understanding of obesity's impact on the respiratory system, but there have been few CT studies evaluating obesity's effects on the lungs and the trachea.
Her team has observed differences on chest CT images obtained in obese individuals, causing the researchers to wonder if these differences were due to obesity and whether they were reversible after weight loss.
Going forward, CT could be an effective way to assess risk in obese patients, according to Copley.
"Lung function may have a prognostic importance in obesity, and can be readily seen on CT," she said. "Other imaging markers like hepatic steatosis [could also be useful], as could incorporating imaging data into deep learning algorithms for individualized risk assessment in obese individuals for cardiovascular and malignancy complications."