Siemens Healthineers has introduced Acuson Redwood, a shared-services ultrasound system and the latest addition to its portfolio of Acuson scanners.
Built on the firm's Acuson platform architecture, Acuson Redwood features contrast-enhanced ultrasound (CEUS) and shear-wave elastography (SWE) applications -- technologies that Siemens had not previously offered in this segment, according to vendor. In addition, Siemens said it has incorporated shared-service cardiology capabilities, as well as artificial intelligence-based tools to improve workflow.
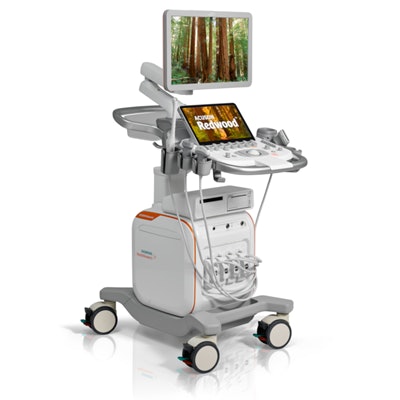
 The Acuson Redwood ultrasound system. Image courtesy of Siemens Healthineers.
Acuson Redwood employs the company's coherent image formation (CIF) technology, which is designed to maintain B-mode image quality even in complex modes, according to the firm. In addition, Acuson Redwood's UltraArt universal image processing technology enables users to choose from several options and avoid having to manually adjust multiple image parameters, the company wrote.
The system includes 13 transducers and is designed to meet the needs of various clinical departments, such as radiology, cardiology, and ob/gyn, according to Siemens. The vendor is also highlighting the cardiac features of Acuson Redwood, such as syngo Velocity Vector Imaging (VVI), a 2D quantitative tool for assessing global and regional myocardial motion and mechanics, stress echocardiography with a wall motion scoring analysis package, and a left ventricular opacification mode to support cardiac contrast imaging.
Acuson Redwood has received U.S. Food and Drug Administration (FDA) 510(k) clearance and the European CE Mark.