French researchers have created patient-specific 3D-printed anatomical models to facilitate presurgical planning and patient consultation for kidney-sparing surgery.
The group from Bordeaux University Hospital has been using a full-color, multimaterial 3D printer (J750, Stratasys) to generate 3D-printed kidney models based on MRI scans.
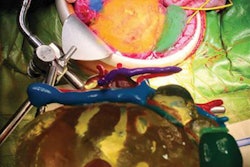
 Clinician examines a 3D-printed kidney model for cancer surgery. Image courtesy of Stratasys.
The models have helped the surgical team from the hospital's department of urology and kidney transplantation identify relevant anatomical structures for kidney cancer surgery more effectively than on conventional medical images. This has helped reduce the risk of damaging surrounding blood vessels, which has proved challenging in the case of complex tumor removal, Dr. Jean-Christophe Bernhard, PhD, noted in a statement.
"The ability to visualize the specific location of a tumor in relation to these other elements, all in three dimensions, greatly facilitates our surgical planning and is not easily achievable from a 2D scan," he said.
Furthermore, Bernhard and colleagues have recently launched a research project, in collaboration with Stratasys, to determine the extent to which improving patient understanding of their surgical procedure with 3D-printed models can improve care and reduce hospitalization times for cases requiring same-day surgery.
"Indeed, initial research from patient questionnaires shows that having 3D-printed models increases their understanding of the surgery by up to 50%, so it's a considerable benefit in terms of overall patient care," Bernhard said.