
Royal Philips saw revenue grow 8% after currency adjustments in the second quarter of fiscal 2018 (end-June 30) in its Diagnosis and Treatment division, which includes the company's medical imaging operations, while operating income grew a similar amount. The company said it saw double-digit growth for the medical division in China, Latin America, and Central and Eastern Europe.
For the period, the Diagnosis and Treatment division posted sales of $2.06 billion (1.761 billion euros), up 5% before currency adjustment from $1.95 billion (1.671 billion euros) in the same quarter of 2017, and up 8% after taking into account currency changes. The unit's operating income was $172 million (147 million euros), up 8% from operating income of $130 million (111 million euros) in the second quarter of 2017.
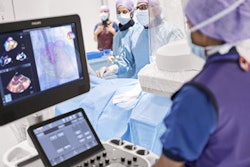
The company said the Diagnosis and Treatment division saw double-digit growth in image-guided therapy, growth in the high single digits in ultrasound, and midsingle-digit growth in diagnostic imaging. On a geographical basis, sales in China, Latin America, and Central and Eastern Europe saw double-digit growth, North America and Western Europe saw midsingle-digit growth, and other mature geographies saw double-digit growth.
In a statement that accompanied the results, Philips CEO Frans van Houten said he was "pleased with the continued strong improvement" in the Diagnosis and Treatment division and also encouraged by order intake growth in the midsingle digits in the Connected Care and Health Informatics business.


![Overview of the study design. (A) The fully automated deep learning framework was developed to estimate body composition (BC) (defined as subcutaneous adipose tissue [SAT] in liters; visceral adipose tissue [VAT] in liters; skeletal muscle [SM] in liters; SM fat fraction [SMFF] as a percentage; and intramuscular adipose tissue [IMAT] in deciliters) from MRI. The fully automated framework comprised one model (model 1) to quantify different BC measures (SAT, VAT, SM, SMFF, and IMAT) as three-dimensional (3D) measures from whole-body MRI scans. The second model (model 2) was trained to identify standardized anatomic landmarks along the craniocaudal body axis (z coordinate field), which allowed for subdividing the whole-body measures into different subregions typically examined on clinical routine MRI scans (chest, abdomen, and pelvis). (B) BC was quantified from whole-body MRI in over 66,000 individuals from two large population-based cohort studies, the UK Biobank (UKB) (36,317 individuals) and the German National Cohort (NAKO) (30,291 individuals). Bar graphs show age distribution by sex and cohort. BMI = body mass index. (C) After the performance assessment of the fully automated framework, the change in BC measures, distributions, and profiles across age decades were investigated. Age-, sex-, and height-adjusted body composition reference curves were calculated and made publicly available in a web-based z-score calculator (https://circ-ml.github.io).](https://img.auntminnieeurope.com/mindful/smg/workspaces/default/uploads/2026/05/body-comp.XgAjTfPj1W.jpg?auto=format%2Ccompress&fit=crop&h=112&q=70&w=112)


