Dear Advanced Visualization Insider
Any activity or technique that promises to enhance the position of the radiologist in a multidisciplinary clinical team must be worth a close look, and that's certainly the case with our news report about the use of 3D modeling in structural heart disease.
Posted today, the article looks at research presented at the recent European Society of Cardiovascular Radiology (ESCR) congress in Milan. Dr. Sergey Morozov from Moscow, a member of the editorial advisory board of AuntMinnieEurope.com, is positive about the study. To find out why he's excited, click here.
The clinical applications of 3D printing continue to expand. In a fascinating case, French surgeons used a 3D-printed model of the spine to simulate and hone a new robot-guided procedure on a 6-year-old boy with severe scoliosis. Get the details here.
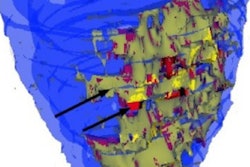
Another group of researchers has proposed a novel approach to chronic wound healing that involves image analysis combined with 3D modeling and bioprinting. They used wound images from patients with diabetes, burns, and metabolic conditions that can cause tissue death. Click here to learn more.
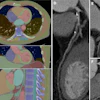
The high quality of cinematic rendering and its power for lifelike visualization of medical images continue to amaze radiologists, but studies demonstrating its usefulness in the clinical arena must play catch-up, according to experts. For their full assessment and to view a stunning selection of images, click here.
This letter features only a few of the many articles posted over recent weeks in the Advanced Visualization Community. You'll find lots more stories by looking over the links below.