The medical imaging business of Royal Philips Electronics reported 2% growth in revenue after currency adjustments for its fiscal first quarter of 2017, while earnings also improved.
For the period, the company's Diagnosis and Treatment segment, which includes Philips Healthcare, posted revenues of $1.62 billion (1.491 billion euros), compared with $1.54 billion (1.419 billion euros) in the first quarter of 2016. The figure represents 5% growth in sales on a comparable-currency basis and a 2% increase after adjusting for currency changes.
The business reported earnings before interest, taxes, and amortization (EBITA) of $56.5 million (52 million euros), compared with an EBITA of $25 million (23 million euros) the year before. Adjusted EBITA was $68.5 million (63 million euros), compared with $34.8 million (32 million euros) in the same quarter of 2016. Earnings as a percent of sales improved during the quarter, Philips reported.
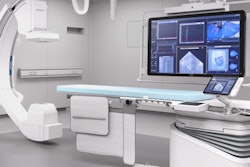
The company noted that after currency adjustments, it saw low-single-digit growth in its Diagnostic Imaging, Ultrasound, and Image-Guided Therapy units. On a geographic basis, it had double-digit growth in China and Latin America, which was partially offset by a double-digit decline in Central and Eastern Europe, and a decline in the midsingle digits in the Middle East and Turkey.
In mature geographies, Philips saw midsingle-digit growth in Western Europe, low-single-digit growth in other mature geographies, and flat sales in North America after currency adjustments. Adjusted EBITA and profit margin improved thanks to positive currency changes and operational improvements.