A 3D image-processing technique that maps the spaces between bones in joints could help predict which individuals will develop osteoarthritis later, offering the disease assessment tool that clinicians have been waiting for, according to researchers from Cambridge University in the U.K.
The group's new 3D image-processing technique may bring about vast improvements over current 2D radiographic methods for evaluating changes in joint disease. The study presented at ECR 2016 used MRI and CT images to accurately map the space between joints in patients with osteoarthritis in 3D. In doing so, the investigators debuted a new platform for joint disease assessment and management. The digital data it outputs is amenable to other types of analysis, the team reported.
 Dr. Tom Turmezei from Addenbrooke's Hospital and Cambridge University in the U.K.
"We can define the two individual cartilage surfaces, and importantly what we have here now are volumes of interest in which we can perform other types of sampling," noted Dr. Tom Turmezei, consultant radiologist at Addenbrooke's Hospital National Health Service (NHS) Trust and PhD candidate in engineering at the University of Cambridge, in his presentation.
A key problem with joint disease evaluation is that most of it still occurs in 2D, and mostly in radiographs. The 2D techniques often deliver an objective interpretation or grading of disease that may not be reliable or sensitive enough to spot relevant changes, a problem which has particularly hampered therapy development for osteoarthritis, he explained in an email to AuntMinnieEurope.com.
"It was my feeling that a 3D approach could eventually deliver greater biomarker sensitivity, reproducibility, accuracy, and reliability, which is desperately needed in order to enable successful therapy development in clinical trials," Turmezei said in his talk.
Starting with the hip joint, over the last three years the team has developed an image analysis pipeline that takes standard clinical CT and MRI to deliver parameters semiautomatically that could be used to predict outcome in the clinic and monitor response to therapies in research trials.
A look inside
The process described at ECR 2016 includes two joint space mapping algorithms: one for CT, one for MRI. Beginning with standard CT or MR acquisitions of the hip, the clinician performs a series of initial preprocessing steps, including the selection of a threshold to isolate the femoral head, then smoothing of automatically generated contours using a homegrown program (Stradwin, Cambridge University). The femoral head is represented as a sphere consisting of about 16,000 vertices in a triangulated mesh; the acetabulum is used to cast a shadow on the surface of the sphere.
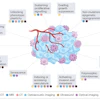
 The joint space mapping process. All images courtesy of Dr. Tom Turmezei.
"We project the shadow of the acetabulum by sampling in 3D along the radius outside the sphere through the interpolated imaging data and averaging the output," Turmezei explained.
A 3D surface segmentation process then generates a joint space patch consisting of about 6,000 vertices, each used as a unique measuring point. A unidimensional measurement line is used to measure across the joint at each vertex in the joint space patch, with a model-based fitting algorithm delivering subchondral bone density, thickness, and joint space width from CT.
The MRI algorithm is similar to the CT scheme in its use of a joint space patch to measure all around the joint in 3D, but instead it outputs cartilage thickness as a surrogate for joint space width based on a hybrid, full-width half-maximum threshold MR technique, he said.
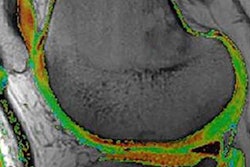
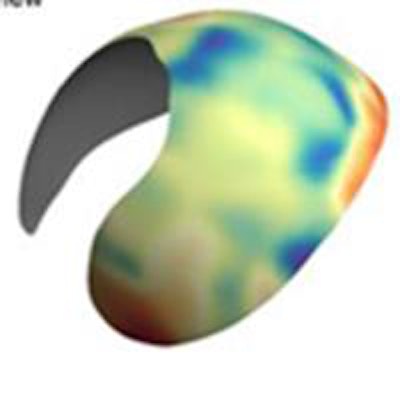
After removing data outliers and smoothing the contours, the joint space is output from CT as the 3D object in yellow, with the green (femur) and blue (acetabulum) regions representing the inner limit of subchondral bone for these structures. The MRI algorithm delivers combined cartilage thickness, but is being developed further to more accurately segment the individual femoral (purple) and acetabular (red) cartilage surfaces more accurately.
Close correlations
The results show 3D joint space maps from 20 cadaveric female right hips displayed on a canonical patch for each parameter, including mean and standard deviation. The correlations between joint space mapping and cartilage thickness was 0.57, that between femoral cortical thickness and trabecular density was 0.17, and the correlation between acetabular cortical thickness and trabecular density was -0.27.
 3D object output from joint space mapping.
"In joint space mapping results, we see we can define ... two cartilage surfaces, and importantly what we have here now are volumes of interest in which we can perform other types of sampling," Turmezei said.
There is good correlation of the cartilage surface, and subchondral bone plate surface can be represented. It's an improvement over how radiologists are measuring joint space and cartilage now, he continued.
"What we are used to seeing is perhaps a single 3-mm MRI slice that is then compressed into a single image; we take a segmented region of interest then we might take a single value for that part of the cartilage," Turmezei said.
In summary, joint space mapping can be used to build a cross-modality, multiparametric model of the hip joint using either CT or MRI to semiautomatically deliver multiple cross-modality parameters that are relevant to several joint diseases, he pointed out. Future work will extend the technique to include additional parameters such as T2-weighted MR and T1 rho-weighted (or spin-lock) mapping to assess cartilage depletion. The emerging technique could establish a platform for joint imaging assessment with a novel impetus on detecting relevant structural changes in both clinical and research settings.
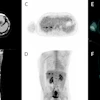
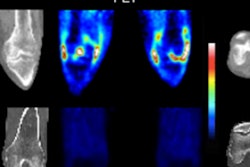
 3D data sampling example from T2-weighted MRI represents a mean T2* map from seven cadavers, 3-mm slice separation, potentially capable of sampling and representing any modality/parameter with appropriate focus and development.
"Space mapping may be particularly relevant for stratification in the coming age of personalized medicine because another great strength is its ability to look at changes in e.g., joint space width (CT), subchondral bone signal (MR), or cartilage T1 rho values (MR) over time," Turmezei wrote in his email. "With stem cell therapy set to make an impact on the treatment of joint diseases such as osteoarthritis, [joint space mapping] could then be used to closely monitor for improvement in patients receiving such 'whole joint' therapies."
Turmezei acknowledged the contributions of the donors who gave their bodies to science, and that of the funders, Wellcome Trust and NIHR Cambridge Biomedical Research Center.