CHICAGO - Using a 15-minute MRI protocol with PET/MR, Swiss researchers achieved diagnostic accuracy equal to that of PET/CT for patients with non-small cell lung cancer (NSCLC).
The study results, presented at the RSNA 2014 annual meeting, suggest that NSCLC patients can be staged without extra time, while being exposed to less radiation than they would get from PET/CT.
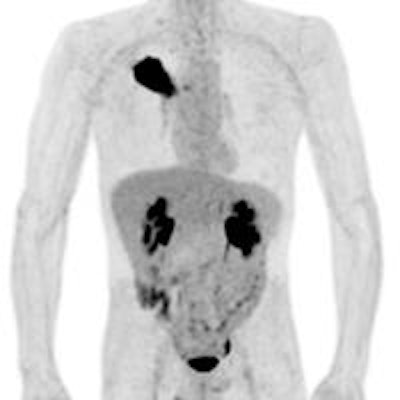
 A 50-year old male patient with NSCLC stage pT2b pN2 cM0, imaged with FDG-PET/CT-MR. On coronal PET maximum intensity projection (MIP) image, an FDG-avid tumor in the right upper lobe and a mediastinal lymph node metastasis are seen. All images courtesy of Dr. Martin Huellner.
For many years, PET/CT has been the standard modality for staging NSCLC patients. So, before PET/MRI can supplant it for this application, some basic clinical questions need to be addressed, said lead author Dr. Martin Huellner from University Hospital Zurich.
"One of them is if PET/MR imaging is equal to or superior to PET/CT in certain cancer entities or organs," he said during his presentation. "Second, which fast MR imaging techniques are most appropriate to achieve high diagnostic accuracy, given the comparably short PET image acquisition time of 10 to 15 minutes?"
The prospective study included 40 consecutive patients (28 men, 12 women) with a median age of 65 years (range, 39 to 85 years). All 40 patients had been referred for initial staging of suspected or biopsy-proven non-small cell lung cancer with FDG-PET/CT.
The imaging protocol consisted of whole-body PET/CT-MR (Discovery 690, GE Healthcare, 3-tesla MRI system MR 750w, GE). The MRI protocol included whole-body coronal short-tau inversion recovery (STIR) for eight minutes, followed by axial whole-body LAVA-Flex acquisition for three minutes and thoracic axial periodically rotated overlapping parallel lines with enhanced reconstruction (PROPELLER) imaging for five minutes. Total MRI acquisition time was approximately 16 minutes.
The reference standard was histopathology for tumor and nodal stage in 17 patients and follow-up with imaging for 23 patients, according to the researchers.
Image results were analyzed in random order, with PET/CT and PET/MR images reviewed by two independent readers to determine tumor, node, and metastasis (TNM) staging.


When staging was correct, the researchers assigned a score of 2. Equivocal results were given a score of 1 and incorrect staging was marked as 0.
PET/MRI and PET/CT performed similarly in terms of TNM staging, Huellner and colleagues found.
| PET/MRI vs. PET/CT for NSCLC staging | ||
| PET/MRI | PET/CT | |
| Tumor | ||
| Correct | 20 patients (63%) | 22 patients (69%) |
| Equivocal | 2 patients (6%) | 1 patient (3%) |
| Incorrect | 10 patients (31%) | 9 patients (28%) |
| Node | ||
| Correct | 22 patients (69%) | 19 patients (59%) |
| Equivocal | 2 patients (6%) | 4 patients (13%) |
| Incorrect | 8 patients (25%) | 9 patients (28%) |
| Metastasis | ||
| Correct | 24 patients (75%) | 20 patients (63%) |
| Equivocal | 0 patients (0%) | 5 patients (16%) |
| Incorrect | 8 patients (25%) | 7 patients (22%) |
The reduced radiation exposure with PET/MRI versus PET/CT could benefit patients with lower-stage tumors in particular, as these patients generally have a better chance of survival and may undergo more follow-up imaging scans.
"TNM staging with PET/MR with 15-minute acquisition time has equivocal accuracy to PET/CT," Huellner concluded. "Thus, lung cancer patients may be effectively staged with PET/MR, which is not much more time-consuming than PET/CT."