FDG-PET/CT can expedite the diagnosis of lung cancer in an outpatient setting, according to research from the Netherlands Cancer Institute in Amsterdam.
The study combined FDG-PET/CT with a fast-track model to evaluate over the course of one day 114 patients experiencing pulmonary symptoms and/or abnormal chest x-rays. Results were published in the October issue of the Journal of Thoracic Oncology (2009, Vol. 4:10, pp. 1226-1230), with Dr. Tjeerd Aukema as the lead author.
The researchers were able to make a final diagnosis for 92% of patients and determine a malignancy in 84% using PET/CT. The results represent a diagnostic gain of 8% and 7%, respectively, compared to previous techniques. The study also demonstrated a sensitivity rate of 97% and an accuracy rate of 82%.
Related Reading
More PET/CT lung masses seen with hardware-based fusion, April 26, 2005
CT, PET staging may negate need for mediastinoscopy in lung cancer, April 11, 2005
FDG-PET/CT tops other technologies for lymphoma staging, March 23, 2005
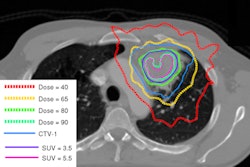
PET/CT planning allows for greater gamble on NSCLC radiotherapy, March 16, 2005
Copyright © 2009 AuntMinnie.com


![Overview of the study design. (A) The fully automated deep learning framework was developed to estimate body composition (BC) (defined as subcutaneous adipose tissue [SAT] in liters; visceral adipose tissue [VAT] in liters; skeletal muscle [SM] in liters; SM fat fraction [SMFF] as a percentage; and intramuscular adipose tissue [IMAT] in deciliters) from MRI. The fully automated framework comprised one model (model 1) to quantify different BC measures (SAT, VAT, SM, SMFF, and IMAT) as three-dimensional (3D) measures from whole-body MRI scans. The second model (model 2) was trained to identify standardized anatomic landmarks along the craniocaudal body axis (z coordinate field), which allowed for subdividing the whole-body measures into different subregions typically examined on clinical routine MRI scans (chest, abdomen, and pelvis). (B) BC was quantified from whole-body MRI in over 66,000 individuals from two large population-based cohort studies, the UK Biobank (UKB) (36,317 individuals) and the German National Cohort (NAKO) (30,291 individuals). Bar graphs show age distribution by sex and cohort. BMI = body mass index. (C) After the performance assessment of the fully automated framework, the change in BC measures, distributions, and profiles across age decades were investigated. Age-, sex-, and height-adjusted body composition reference curves were calculated and made publicly available in a web-based z-score calculator (https://circ-ml.github.io).](https://img.auntminnieeurope.com/mindful/smg/workspaces/default/uploads/2026/05/body-comp.XgAjTfPj1W.jpg?auto=format%2Ccompress&fit=crop&h=112&q=70&w=112)


