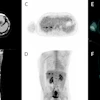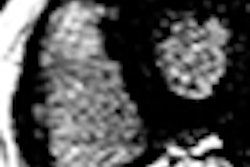
NEW YORK (Reuters Health), Dec 3 - When noncalcified lung nodules are detected by CT, assessment of their volume and volume-doubling time with repeat CT scans can be useful for deciding the best course of action, new research suggests.
"In a population that was at an increased risk for lung cancer, our strategy of screening for lung cancer with the use of volume CT diminished the need for follow-up evaluation in participants with an indeterminate test result. This strategy was especially useful during the second-round screening," Dr. Rob J. van Klaveren and co-researchers note.
As reported in the New England Journal of Medicine for December 3, Dr. van Klaveren, from Erasmus Medical Center, Rotterdam, the Netherlands, and co-researchers assessed lung cancer occurrence in 7757 subjects who underwent CT screening at baseline (first round), 1 year later (second round) and 3 years later (third round, 2 years after second round).
Software was used to assess volume or volume-doubling times of noncalcified nodules. Subjects with an indeterminate result in the first round of screening underwent repeat CT assessment at 3 months.
Nodule growth was defined as an increase in volume of 25% or more between two scans. The first round of screening was considered negative if the nodule volume was less than 50 microliters, if the volume was 50 to 500 microliters but had not changed at 3 months, or (if the nodules did grow) if the volume-doubling time was at least 400 days. Similar criteria were used during the second round. All subjects with a negative second-round test were invited to undergo the third round of screening.
A positive test result was obtained in 2.6% and 1.8% of subjects in the first and second rounds of screening, respectively.
The first round of screening was associated with a sensitivity of 94.6% and a negative predictive value of 99.9%. In the 7361 subjects who had a negative result in round one, 20 lung cancers were identified during 2 years of follow-up.
"The results suggest that the efficiency of the diagnostic work-up for lung cancer can be improved by integrating the measurement of volume growth of lung nodules as an indicator of clinically significant lung cancer while limiting the need for additional costly or potentially harmful diagnostic procedures," Dr. James L. Mulshine, from Rush University Medical Center, Chicago, and Dr. David M. Jablons, from the University of California, San Francisco, write in a related editorial.
N Engl J Med 2009;361:2221-2229,2281-2282.
Last Updated: 2009-12-02 17:00:29 -0400 (Reuters Health)
Related Reading
Copyright © 2009 Reuters Limited. All rights reserved. Republication or redistribution of Reuters content, including by framing or similar means, is expressly prohibited without the prior written consent of Reuters. Reuters shall not be liable for any errors or delays in the content, or for any actions taken in reliance thereon. Reuters and the Reuters sphere logo are registered trademarks and trademarks of the Reuters group of companies around the world.