In 2014, the average time between repeat CT scans for the same patient at University Hospital Basel was 14 days. By 2024, it had fallen to 10. At the twenty-fifth percentile, some patients were being reimaged every three days.
That quiet shift, tracked over a decade by Dr. Tobias Heye, sits at the heart of a message that an ESR/ESOR webinar on 27 April 2026 tried to get across: operational efficiency gains and scanner power-saving modes are valuable, but they won't be enough if imaging volumes keep rising unchecked.
The webinar, part of the "Special Focus Series: Sustainability in Radiology," was jointly organized by the European Society of Radiology (ESR), the European School of Radiology (ESOR), and the European Federation of Radiographer Societies (EFRS).
Healthcare rewards ordering
Heye, senior consultant in Radiology and Nuclear Medicine at University Hospital Basel in Basel, Switzerland, tracked imaging utilization at his own institution from 2011 to 2025. What he observed: daytime schedules grew denser, off-hours scanning increased and the modality mix shifted toward higher-carbon CT and MRI.
 "We need metrics like this," said Dr. Tobias Heye, on tracking diagnostic resource use per clinician.Courtesy of Claudia Tschabuschnig
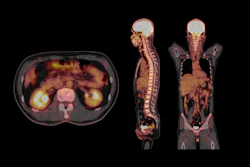
In pulmonary embolism workups, diagnostic yield declined over the same period. Most positive findings turned out to be pneumonia, diagnosable with a chest x-ray at roughly one-tenth the CO2 cost. The COVID-19 pandemic accelerated a shift toward CT for suspected pneumonia that never fully reversed. Heye calculated the cost: 32 tons of excess CO2, and a radiation burden equivalent to 14 return trips from Earth to Mars.
The deeper problem, he argued, is structural. Healthcare rewards ordering. While a scan generates activity, restraint doesn't. There's no systematic feedback showing clinicians how many diagnostic resources they use per diagnosis compared to peers treating comparable cases. He called it the "master carpenter" problem: one carpenter builds a table with one plank, another uses six, and nobody asks why. "We need metrics like this," Heye said.
CT now carries a cancer risk comparable to alcohol and obesity as a malignancy risk factor. So the sustainability case and the patient safety case are pointing at the same gap.
Known fixes, uneven uptake
Andrew England, PhD, Senior Lecturer in Medical Imaging and Radiation Therapy at University College Cork in Ireland, focused on what departments can do today. Healthcare contributes between 8% and 10% of national energy consumption in many countries, with radiology in the top three energy-consuming departments. Two-thirds of a CT scanner's energy is consumed when no patient is in the room.
 "If we're going to reduce it, we need to know where we start," said Andrew England, PhD.Courtesy of Claudia Tschabuschnig
The interventions England described are not complicated, or new. Turning off surplus scanners during low-demand hours can cut CO2 emissions by up to a third. Eco power modes can reduce consumption by up to 60%. Powering workstations down overnight saves around 25 tons of CO2 per department per year. In one study he cited, staff compliance with a simple shutdown protocol ranged from 10% to 80% in the same building. "If we're going to reduce it, we need to know where we start," England said.
Kindness with backlash
He added one figure that tends to land with some surprise: acknowledgement emails in U.K. healthcare, the "noted," the "thanks," generate around 16,000 tons of CO2 annually. More than 3,000 diesel cars running for a year. That intervention costs nothing and requires no equipment upgrade.
MRI and the gap between patients
Andrea Roletto, a radiographer and coordinator at IRCCS Ospedale San Raffaele in Milan, Italy, presented findings from recently completed doctoral research on MRI energy profiles. He broke consumption into three phases: scan, idle, and standby. The idle phase, the time between patients, carries the largest preventable losses.
Shorter protocols, AI-assisted scheduling to reduce no-shows, and vendor power-save modes all shrink idle time. HVAC systems compound the cost, since every scheduling gap triggers a thermal restabilization cycle. Roletto's practical argument was that scheduling is not just a workflow issue, it's an environmental one.
The metric that doesn't exist yet
Spanning the arrow, the three presentations described a field with two distinct problems. The first is operational: machines run too long, lights stay on, habits lag behind available technology.
And the second problem is structural. Imaging volume is rising while repeat intervals are shrinking. Higher-carbon modalities are replacing lower-carbon ones and there is no feedback mechanism at the point of ordering that captures any of it.
The ESR position paper on sustainable imaging, backed by 11 radiology societies and published in February 2025, called for stronger industry partnerships and sustainable departmental practices. What the webinar added is a gap the paper doesn't yet fill: a metric that tells a clinician, in real time, how their diagnostic resource use compares to peers treating the same conditions.
Until that exists, turning off the lights at night is necessary, yet it isn't sufficient.