Head position during brain and inner-ear MRI can affect patient comfort, and can also create artifacts that could influence image interpretation, according to findings from a Karl Landsteiner University (KL Krems) pilot study.
The KL Krems team -- jointly led by Prof. Dr. Domagoj Javor, head of the Institute of Diagnostic and Interventional Radiology, and Dr. Béla Büki, from the Division of Otorhinolaryngology, both at KL Krems‘ teaching and research center University Hospital Krems, Krems an der Donau, Austria -- conducted the pilot study. It published findings in the European Journal of Radiology (EJR).
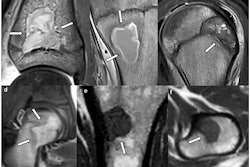
This pilot study was designed to test whether “flow voids” --small, sharply outlined low-signal areas in the vestibule that do not match any anatomical structure -- behave like flow-related artifacts, and if they change with the pitch of the patient’s head, noted a statement issued on 17 February by the Austrian facility.
The cohort number was low, as the study was intended to provide proof of principle.
Examining 20 healthy adults without known vestibular disease in a 3-tesla scanner, the team found that the characteristic hypointense flow void artifacts in the inner ear become considerably more pronounced -- by around 15% -- on both sides with the patient’s head tilted back and less so with the chin tilted down.
The findings showed that as these vestibular dark spots change with head position, they are position-dependent artifacts rather than a pathological inner-ear finding, according to the authors.
Furthermore, three of the 20 study volunteers (about 15%) reported mild vertigo when their heads were tilted back; none of the volunteers reported this with their chins tilted down.
The team explained that the static magnetic field in MRI can interact with tiny electric currents in the inner ear fluids, which creates so-called Lorentz forces. Lorentz forces have been demonstrated to trigger nystagmus (uncontrolled rhythmic eye movement) and vertigo in people with normal vestibules, the balance system of the inner ear.
The authors said that if a suspicious vestibular hypointensity appears on a T2 spin-echo sequence, verifying if it changes with head position or across different sequence types can be helpful in identifying it as an artifact or a true lesion.
Gradient-echo sequences, which are less sensitive to slow fluid motion, may serve as a useful comparison, they added.
Read the findings on the EJR site here.


![Overview of the study design. (A) The fully automated deep learning framework was developed to estimate body composition (BC) (defined as subcutaneous adipose tissue [SAT] in liters; visceral adipose tissue [VAT] in liters; skeletal muscle [SM] in liters; SM fat fraction [SMFF] as a percentage; and intramuscular adipose tissue [IMAT] in deciliters) from MRI. The fully automated framework comprised one model (model 1) to quantify different BC measures (SAT, VAT, SM, SMFF, and IMAT) as three-dimensional (3D) measures from whole-body MRI scans. The second model (model 2) was trained to identify standardized anatomic landmarks along the craniocaudal body axis (z coordinate field), which allowed for subdividing the whole-body measures into different subregions typically examined on clinical routine MRI scans (chest, abdomen, and pelvis). (B) BC was quantified from whole-body MRI in over 66,000 individuals from two large population-based cohort studies, the UK Biobank (UKB) (36,317 individuals) and the German National Cohort (NAKO) (30,291 individuals). Bar graphs show age distribution by sex and cohort. BMI = body mass index. (C) After the performance assessment of the fully automated framework, the change in BC measures, distributions, and profiles across age decades were investigated. Age-, sex-, and height-adjusted body composition reference curves were calculated and made publicly available in a web-based z-score calculator (https://circ-ml.github.io).](https://img.auntminnieeurope.com/mindful/smg/workspaces/default/uploads/2026/05/body-comp.XgAjTfPj1W.jpg?auto=format%2Ccompress&fit=crop&h=100&q=70&w=100)


![Overview of the study design. (A) The fully automated deep learning framework was developed to estimate body composition (BC) (defined as subcutaneous adipose tissue [SAT] in liters; visceral adipose tissue [VAT] in liters; skeletal muscle [SM] in liters; SM fat fraction [SMFF] as a percentage; and intramuscular adipose tissue [IMAT] in deciliters) from MRI. The fully automated framework comprised one model (model 1) to quantify different BC measures (SAT, VAT, SM, SMFF, and IMAT) as three-dimensional (3D) measures from whole-body MRI scans. The second model (model 2) was trained to identify standardized anatomic landmarks along the craniocaudal body axis (z coordinate field), which allowed for subdividing the whole-body measures into different subregions typically examined on clinical routine MRI scans (chest, abdomen, and pelvis). (B) BC was quantified from whole-body MRI in over 66,000 individuals from two large population-based cohort studies, the UK Biobank (UKB) (36,317 individuals) and the German National Cohort (NAKO) (30,291 individuals). Bar graphs show age distribution by sex and cohort. BMI = body mass index. (C) After the performance assessment of the fully automated framework, the change in BC measures, distributions, and profiles across age decades were investigated. Age-, sex-, and height-adjusted body composition reference curves were calculated and made publicly available in a web-based z-score calculator (https://circ-ml.github.io).](https://img.auntminnieeurope.com/mindful/smg/workspaces/default/uploads/2026/05/body-comp.XgAjTfPj1W.jpg?auto=format%2Ccompress&fit=crop&h=112&q=70&w=112)


