CHICAGO -- Diffusion tensor imaging (DTI-MRI) reveals declines in the brain microstructure and function caused by football heading, where a player hits the ball with their head, a study presented November 28 at the RSNA annual meeting found.
In her talk, Dr. Molly Charney from New York-Presbyterian Hospital presented research showing that the normally sharp gray matter-white matter interface seen on imaging was blunted in proportion to high repetitive head impact exposure.
“These results suggest greater heading exposure over two years is associated with adverse effects on white matter microstructure in young adult amateur [football] players,” Charney said.
Previous studies have examined the impact of repetitive head impacts in football on cognitive and neuroimaging outcomes. However, Chaney and colleagues pointed out that few studies have reported on the longitudinal effects of these head impacts on neuroimaging and cognitive performance.
The researchers wanted to study the association of football heading over two years with change in brain microstructure and cognitive performance in adult amateur players. They used DTI, an MRI technique that characterizes the microstructure of the brain by tracking the microscopic movement of water molecules through brain tissue.
Charney and colleagues included data from 148 football players with an average age of 26.7 years. Using questionnaire data, they categorized repeated head impacts as low (0-556 total headers), moderate (564-1,512 total headers), or high (1,538-23,462 total headers).
The team found that compared with baseline test results, the high-heading group showed increased mean, radial, and axial diffusivity in frontal white-matter regions. This group also demonstrated decreased orientation dispersion index in the right superior frontal white-matter and superior corona radiata.
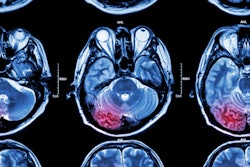
 Researchers used diffusion tensor imaging, an MRI technique, to study the impact of football heading on the brain. This method tracks the microscopic movement of water molecules through brain tissue to characterize the brain's microstructure. Image and caption courtesy of the RSNA.
Additionally, Charney's group reported that the gray matter-white matter interface on DTI-MRI appeared more blunted and had a fuzzier transition in the high-header group. They added that this may play a role in the adverse association between repetitive head impacts and cognitive performance.
The investigators also found that the low- and moderate-heading groups showed decreased mean, radial, and axial diffusivity, as well as increased orientation dispersion index in the same period. And while the high-heading group showed a decline in verbal learning performance over the two years, the low- and moderate-heading groups showed improvement in verbal learning, though these did not reach statistical significance.
Finally, the team stressed that their results suggest a subclinical effect from repeated head impacts in football. However, they also called for longitudinal studies in diverse cohorts to find out the long-term effects, noting that this could better inform intervention and policy.