
Dear MRI Insider,
Cinematic rendering is relatively well known as a postprocessing technique for 3D visualization of CT image data but slightly less so when it comes to MRI data. That's presumably why the RSNA judges gave a top award to U.K. researchers who focused on cinematic rendering of musculoskeletal MRI.
Cinematic rendering comprises state-of-the-art postprocessing for MRI, providing far superior resolution and image interrogation to all previous forms of volume rendering, the prize-winning authors say. Don't miss our news report.
In another article from the RSNA, a German team reported that an artificial intelligence algorithm can identify cirrhosis on standard T2-weighted liver MRI exams at a level comparable to that of an expert reader, offering promise as a tool for improving detection.
In other news, a U.K. inquest has heard that a delay of at least two days due to a broken MRI machine might have contributed to the death of a 51-year-old man from sepsis. A string of failures prior to the patient's death seems to have occurred, including the lack of a checklist for cases of sepsis.
A dispute over MRI's role in breast screening is escalating in the Netherlands. The Health Council is against providing MRI screening to women with dense breasts because of the anxiety caused by a false-positive result and unnecessary follow-up diagnostic exams, but the Dutch Society of Radiology is convinced that the evidence confirms the efficacy of screening with MRI in women with dense breasts.
Speaking of breast MRI, German pioneer Prof. Dr. Christiane Kuhl received the Most Influential Radiology Researcher award in the 2020 EuroMinnies. Who will follow in the footsteps of Kuhl and other previous winners? Nominations for the 2021 scheme will remain open until Friday, 11 December, so if you've not done so already, please do get involved and cast your nominations today.
This letter features only a few of the many reports posted recently in the MRI Community. Please scroll through the full list below and contact me if you have ideas for future coverage.

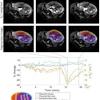
![Overview of the study design. (A) The fully automated deep learning framework was developed to estimate body composition (BC) (defined as subcutaneous adipose tissue [SAT] in liters; visceral adipose tissue [VAT] in liters; skeletal muscle [SM] in liters; SM fat fraction [SMFF] as a percentage; and intramuscular adipose tissue [IMAT] in deciliters) from MRI. The fully automated framework comprised one model (model 1) to quantify different BC measures (SAT, VAT, SM, SMFF, and IMAT) as three-dimensional (3D) measures from whole-body MRI scans. The second model (model 2) was trained to identify standardized anatomic landmarks along the craniocaudal body axis (z coordinate field), which allowed for subdividing the whole-body measures into different subregions typically examined on clinical routine MRI scans (chest, abdomen, and pelvis). (B) BC was quantified from whole-body MRI in over 66,000 individuals from two large population-based cohort studies, the UK Biobank (UKB) (36,317 individuals) and the German National Cohort (NAKO) (30,291 individuals). Bar graphs show age distribution by sex and cohort. BMI = body mass index. (C) After the performance assessment of the fully automated framework, the change in BC measures, distributions, and profiles across age decades were investigated. Age-, sex-, and height-adjusted body composition reference curves were calculated and made publicly available in a web-based z-score calculator (https://circ-ml.github.io).](https://img.auntminnieeurope.com/mindful/smg/workspaces/default/uploads/2026/05/body-comp.XgAjTfPj1W.jpg?auto=format%2Ccompress&fit=crop&h=100&q=70&w=100)


![Overview of the study design. (A) The fully automated deep learning framework was developed to estimate body composition (BC) (defined as subcutaneous adipose tissue [SAT] in liters; visceral adipose tissue [VAT] in liters; skeletal muscle [SM] in liters; SM fat fraction [SMFF] as a percentage; and intramuscular adipose tissue [IMAT] in deciliters) from MRI. The fully automated framework comprised one model (model 1) to quantify different BC measures (SAT, VAT, SM, SMFF, and IMAT) as three-dimensional (3D) measures from whole-body MRI scans. The second model (model 2) was trained to identify standardized anatomic landmarks along the craniocaudal body axis (z coordinate field), which allowed for subdividing the whole-body measures into different subregions typically examined on clinical routine MRI scans (chest, abdomen, and pelvis). (B) BC was quantified from whole-body MRI in over 66,000 individuals from two large population-based cohort studies, the UK Biobank (UKB) (36,317 individuals) and the German National Cohort (NAKO) (30,291 individuals). Bar graphs show age distribution by sex and cohort. BMI = body mass index. (C) After the performance assessment of the fully automated framework, the change in BC measures, distributions, and profiles across age decades were investigated. Age-, sex-, and height-adjusted body composition reference curves were calculated and made publicly available in a web-based z-score calculator (https://circ-ml.github.io).](https://img.auntminnieeurope.com/mindful/smg/workspaces/default/uploads/2026/05/body-comp.XgAjTfPj1W.jpg?auto=format%2Ccompress&dpr=2&fit=crop&h=167&q=70&w=250)


