
Dear AuntMinnieEurope Member,
Novel coronavirus disease (COVID-19) has arrived across much of Europe this week, but Italy is the country facing the greatest upheaval from the outbreak.
To discover how the medical imaging community is coping, we interviewed three senior radiologists and one nuclear medicine specialist from the north of Italy. They were very happy to share their experiences and views of COVID-19, and you can read more in our CT Community.
The optimum use of shielding in CT and x-ray examinations is an extremely contentious issue. Practices appear to vary widely, and there's currently a lack of clear guidance from the relevant authorities and societies. To shine light on this area, we invited radiographers in Ireland, Portugal, Sweden, the U.K., and the Netherlands to tell us about their approach to radiation protection. Don't miss our special report.
Important results from a 48-center breast MRI trial were published in JAMA on 25 February, and they deserve a close look, particularly because the authors give a very positive assessment of abbreviated MRI. Learn more in the MRI Community.
Dr. Christiane Kuhl was the senior and corresponding author of this JAMA article, and on the same day we revealed that she was the winner of the Most Influential Radiology Researcher award in the 2020 EuroMinnies. You can read more about the winners in all eight categories in the Women's Imaging Community. The trophies will be presented at ECR 2020.
Over the past four months, many of you have read our reports about the MRI accident in Swedish Lapland. The case has now been closed, after the prosecutor decided not to take action against the injured specialist nurse.
Finally, prehydrating patients who have chronic kidney disease before they undergo contrast-enhanced CT has been the standard of care for some years now, but new Dutch research suggests this practice results in unnecessary costs with few patient benefits.

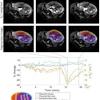
![Overview of the study design. (A) The fully automated deep learning framework was developed to estimate body composition (BC) (defined as subcutaneous adipose tissue [SAT] in liters; visceral adipose tissue [VAT] in liters; skeletal muscle [SM] in liters; SM fat fraction [SMFF] as a percentage; and intramuscular adipose tissue [IMAT] in deciliters) from MRI. The fully automated framework comprised one model (model 1) to quantify different BC measures (SAT, VAT, SM, SMFF, and IMAT) as three-dimensional (3D) measures from whole-body MRI scans. The second model (model 2) was trained to identify standardized anatomic landmarks along the craniocaudal body axis (z coordinate field), which allowed for subdividing the whole-body measures into different subregions typically examined on clinical routine MRI scans (chest, abdomen, and pelvis). (B) BC was quantified from whole-body MRI in over 66,000 individuals from two large population-based cohort studies, the UK Biobank (UKB) (36,317 individuals) and the German National Cohort (NAKO) (30,291 individuals). Bar graphs show age distribution by sex and cohort. BMI = body mass index. (C) After the performance assessment of the fully automated framework, the change in BC measures, distributions, and profiles across age decades were investigated. Age-, sex-, and height-adjusted body composition reference curves were calculated and made publicly available in a web-based z-score calculator (https://circ-ml.github.io).](https://img.auntminnieeurope.com/mindful/smg/workspaces/default/uploads/2026/05/body-comp.XgAjTfPj1W.jpg?auto=format%2Ccompress&fit=crop&h=100&q=70&w=100)

![Overview of the study design. (A) The fully automated deep learning framework was developed to estimate body composition (BC) (defined as subcutaneous adipose tissue [SAT] in liters; visceral adipose tissue [VAT] in liters; skeletal muscle [SM] in liters; SM fat fraction [SMFF] as a percentage; and intramuscular adipose tissue [IMAT] in deciliters) from MRI. The fully automated framework comprised one model (model 1) to quantify different BC measures (SAT, VAT, SM, SMFF, and IMAT) as three-dimensional (3D) measures from whole-body MRI scans. The second model (model 2) was trained to identify standardized anatomic landmarks along the craniocaudal body axis (z coordinate field), which allowed for subdividing the whole-body measures into different subregions typically examined on clinical routine MRI scans (chest, abdomen, and pelvis). (B) BC was quantified from whole-body MRI in over 66,000 individuals from two large population-based cohort studies, the UK Biobank (UKB) (36,317 individuals) and the German National Cohort (NAKO) (30,291 individuals). Bar graphs show age distribution by sex and cohort. BMI = body mass index. (C) After the performance assessment of the fully automated framework, the change in BC measures, distributions, and profiles across age decades were investigated. Age-, sex-, and height-adjusted body composition reference curves were calculated and made publicly available in a web-based z-score calculator (https://circ-ml.github.io).](https://img.auntminnieeurope.com/mindful/smg/workspaces/default/uploads/2026/05/body-comp.XgAjTfPj1W.jpg?auto=format%2Ccompress&dpr=2&fit=crop&h=167&q=70&w=250)


