MRI, CT, and ultrasound identify blood clots not found on clinical assessment in a majority of individuals who have COVID-19 vaccine-induced low blood platelets after their first dose of the AstraZeneca vaccine, according to a case study published on 14 June in Radiology.
The findings could help clinicians better care for patients who have received the AstraZeneca inoculation and have developed what is called vaccine-induced immune thrombotic thrombocytopenia (VITT), wrote a team led by Priya Rogers of Addenbrooke's Hospital in Cambridge, U.K.
"Whole-body imaging can identify patients who require early referral to specialist vascular or hepatobiliary centers [due to VITT]," the group noted.
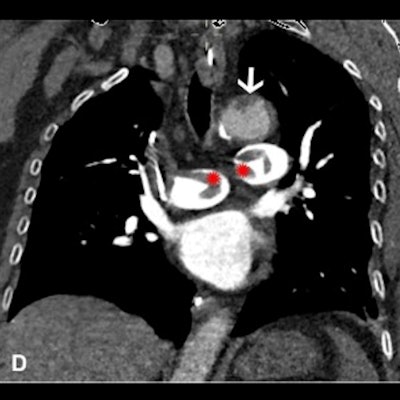
 Images in a 64-year-old woman who presented with confusion and collapse and was diagnosed with intracranial hemorrhage associated with cerebral venous sinus thrombosis secondary to VITT. (A) Axial unenhanced head CT image demonstrates a large right parietal lobe intraparenchymal hemorrhage and (B) bilateral infarcts in the cerebellum confirmed on axial brain T2-weighted MRI. (D) CT pulmonary angiogram coronal reformatted image shows eccentric mural thrombus within the aorta (white arrow) and large central saddle embolus (red asterisks). Images and caption courtesy of the RSNA.
Experts recommend symptom-specific imaging for VITT, but its prevalence remains unclear, Rogers and colleagues noted. To clarify the question, the group conducted a study that included 40 patients who developed thrombocytopenia after receiving their first dose of the AstraZeneca vaccine. The patients were imaged with CT, ultrasound, and/or MRI depending on protocol in seven different centers across the U.K.
Of these 40 patients, 80% developed thrombosis symptoms within 14 days and 20% within 14 to 28 days. The investigators also found the following:
- 75% of patients underwent additional imaging, primarily with CT pulmonary angiogram or CT of the abdomen or pelvis.
- 83% of those patients who had additional imaging were found to have hidden blood clots.
- 73% of the patient cohort presented with neurological symptoms (headache, blurred vision, seizure, collapse) and were confirmed by CT or MR venogram to have a cerebral venous sinus blood clot.
- 30% had extension of their primary blood clot.
- 20% of the total cohort died (eight of 40); those with confirmed progressive thrombosis (four patients) had a mortality rate of 50%.
Most patients underwent some form of CT imaging, the authors noted.
| Imaging modality within 48 hours of admission for symptoms of blood clotting | |||||||
| Total patients | MRI abdomen with contrast | Ultrasound duplex abdomen | Ultrasound duplex peripheral veins | CT abdomen/pelvis with contrast | CT pulmonary angiogram | CT chest abdomen/pelvis with contrast/CT aortogram | CT head and CT/MRI venogram |
| 40 | 1 | 1 | 1 | 9 | 15 | 15 | 39 |
Imaging can play a key role in identifying and dealing with vaccine complications, according to Rogers and colleagues.
"[Our] findings emphasize that VITT is a multisystem disorder and suggest that whole-body contrast-enhanced imaging is likely to identify further thrombosis," they concluded.