
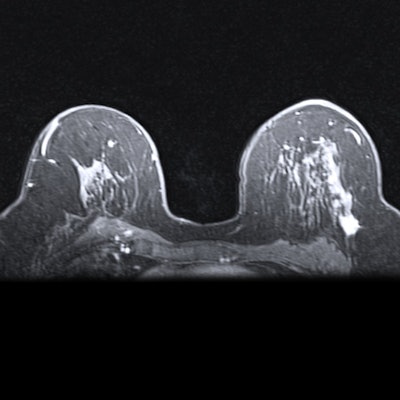
Preprocedural breast MRIs allow for more tailored surgical planning, but have triggered a rise in mastectomy, foiling breast conservation surgeries, according to a study that has been highlighted by the European Society of Radiology.
This research highlights the need for a better understanding of the effect of preoperative breast MRI on clinical decision-making.
Data from 5,896 patients, excluding candidates to neoadjuvant therapy, were collected from 27 clinical centers worldwide between June 2013 and November 2018 and subsequently analyzed.
The current patient selection to preoperative breast MRI implies an 11% increase in mastectomies, counterbalanced by a 3% reduction of the reoperation rate, according to the study.
Nevertheless, this data can be used to support discussion in tumor boards when preoperative MRI is being considered and should be shared with patients to achieve informed decision-making.
The full results have been published in European Radiology.


![Overview of the study design. (A) The fully automated deep learning framework was developed to estimate body composition (BC) (defined as subcutaneous adipose tissue [SAT] in liters; visceral adipose tissue [VAT] in liters; skeletal muscle [SM] in liters; SM fat fraction [SMFF] as a percentage; and intramuscular adipose tissue [IMAT] in deciliters) from MRI. The fully automated framework comprised one model (model 1) to quantify different BC measures (SAT, VAT, SM, SMFF, and IMAT) as three-dimensional (3D) measures from whole-body MRI scans. The second model (model 2) was trained to identify standardized anatomic landmarks along the craniocaudal body axis (z coordinate field), which allowed for subdividing the whole-body measures into different subregions typically examined on clinical routine MRI scans (chest, abdomen, and pelvis). (B) BC was quantified from whole-body MRI in over 66,000 individuals from two large population-based cohort studies, the UK Biobank (UKB) (36,317 individuals) and the German National Cohort (NAKO) (30,291 individuals). Bar graphs show age distribution by sex and cohort. BMI = body mass index. (C) After the performance assessment of the fully automated framework, the change in BC measures, distributions, and profiles across age decades were investigated. Age-, sex-, and height-adjusted body composition reference curves were calculated and made publicly available in a web-based z-score calculator (https://circ-ml.github.io).](https://img.auntminnieeurope.com/mindful/smg/workspaces/default/uploads/2026/05/body-comp.XgAjTfPj1W.jpg?auto=format%2Ccompress&fit=crop&h=112&q=70&w=112)


