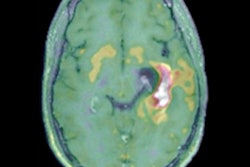
PET scans with the radiotracer F-18 fluorothymidine (FLT) can help determine which glioblastoma patients have the best chance for longer survival, according to a study published online on July 21 in the European Journal of Nuclear Medicine and Molecular Imaging.
Researchers found that changes in standardized uptake values (SUVs) on PET scans performed four weeks after the completion of chemoradiotherapy indicated which patients were trending toward improved survival. But the modality wasn't able to distinguish between "pseudoprogression" and true progression of disease as found on MRI scans, wrote lead author Dr. Cyrillo Brahm and colleagues from University Medical Center Groningen in the Netherlands.
Glioblastoma is the most common and aggressive primary brain tumor, accounting for more than 50% of all gliomas at a rate of 3.19 per 100,000 in the U.S., the group noted. PET has been used for tumor grading and staging, with FLT-PET outperforming FDG-PET and MRI in predicting survival and recurrence in glioma patients.
For the current study, Brahm and colleagues enrolled 30 patients (28 with grade IV glioblastoma and two with grade IV gliosarcoma) between 2009 and 2012. FLT-PET scans (ECAT Exact HR+ or mCT PET, Siemens Healthineers) were performed before treatment and again 10 weeks after the start of chemoradiotherapy (four weeks after completion). Patients received 200 MBq of FLT before the baseline PET scan and at their follow-up scan.
The patients also underwent a 1.5-tesla MRI scan within 72 hours of surgery for baseline images. Follow-up MRI was conducted 10 weeks after the start of treatment, 22 weeks after the start of treatment, and every three months thereafter.
The MRI scans were performed to distinguish between pseudoprogression, defined as progressive disease at 10 weeks but stabilization or reduction of lesions at 22 weeks, and true disease progression, defined as progressive disease on MRI at both 10 weeks and 22 weeks.
By the end of December 2017, 27 patients (90%) had died and three were reported with the last-known date of life. The median overall survival in all patients was 14.1 months.
SUVmax at baseline was significantly associated with survival, with a hazard ratio of 3.03 (p < 0.001), according to the researchers. The association was also significant at 10 weeks, with a hazard ratio of 5.16 (p = 0.002). In addition, a decrease in FLT uptake over time was associated with improved survival, nearly reaching statistical significance (p = 0.059).
On the other hand, the FLT-PET parameters did not differ significantly between those with pseudoprogression and true disease progression, based on the MR images.
While the researchers were encouraged by the results, they also emphasized that "further studies are necessary to investigate the ability of FLT-PET imaging to discriminate between true progression and pseudoprogression in patients with glioblastomas."