
Unfavorable currency changes drove down revenue for the second quarter at Siemens Healthineers in the company's first full financial reporting period since its initial public offering (IPO) last month.
For the quarter (end-March 31), Siemens Healthineers reported revenue of 3.226 billion euros ($3.86 million U.S.), down 5% on an actual basis but up 4% after adjusting for currency effects. The company posted a profit of 457 million euros ($547 million) in the most recent quarter, compared with 546 million euros ($654 million) for the second quarter of 2017, but much of the decline was due to severance costs and expenses related to the IPO. Currency effects also affected profitability.
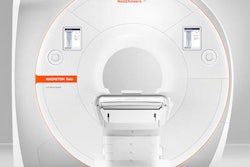
Siemens Healthineers reported a profit margin of 17.4%, compared with 16.5% in the same quarter a year ago; the improvement was driven by higher volume in the company's Imaging segment, mainly due to MRI and CT sales.
On a segment basis, the Imaging division posted total revenue of 1.946 billion euros ($2.33 billion), down 3% on an actual basis but up 6% after currency adjustments. Segment profit was 371 million euros ($444 million), compared with 340 million euros ($407 million) in the second quarter of 2017.
The division saw a "significant increase" in its MRI, CT, and ultrasound businesses, with growth occurring in the U.S., China, and Latin America. As with the overall company, currency effects negatively affected revenue growth by nine percentage points.


![Overview of the study design. (A) The fully automated deep learning framework was developed to estimate body composition (BC) (defined as subcutaneous adipose tissue [SAT] in liters; visceral adipose tissue [VAT] in liters; skeletal muscle [SM] in liters; SM fat fraction [SMFF] as a percentage; and intramuscular adipose tissue [IMAT] in deciliters) from MRI. The fully automated framework comprised one model (model 1) to quantify different BC measures (SAT, VAT, SM, SMFF, and IMAT) as three-dimensional (3D) measures from whole-body MRI scans. The second model (model 2) was trained to identify standardized anatomic landmarks along the craniocaudal body axis (z coordinate field), which allowed for subdividing the whole-body measures into different subregions typically examined on clinical routine MRI scans (chest, abdomen, and pelvis). (B) BC was quantified from whole-body MRI in over 66,000 individuals from two large population-based cohort studies, the UK Biobank (UKB) (36,317 individuals) and the German National Cohort (NAKO) (30,291 individuals). Bar graphs show age distribution by sex and cohort. BMI = body mass index. (C) After the performance assessment of the fully automated framework, the change in BC measures, distributions, and profiles across age decades were investigated. Age-, sex-, and height-adjusted body composition reference curves were calculated and made publicly available in a web-based z-score calculator (https://circ-ml.github.io).](https://img.auntminnieeurope.com/mindful/smg/workspaces/default/uploads/2026/05/body-comp.XgAjTfPj1W.jpg?auto=format%2Ccompress&fit=crop&h=112&q=70&w=112)


