A multicenter study conducted in Saudi Arabia and the United Arab Emirates has underlined the value of implementing dose-reduction techniques for coronary CT angiography (CCTA) and coronary calcium score examinations.
Recent advances in cardiac CT allow for the performance of coronary CT angiography at very low radiation doses, explained Dr. Mouaz Al Mallah, section head for cardiac imaging at the King Abdulaziz Cardiac Center (KACC), King Saud bin Abdulaziz University for Health Sciences, King Abdullah International Medical Research in Riyadh, Saudi Arabia.
Starting in 2010, dose-lowering tools -- including high-pitch scanning, 100 kVp imaging, and iterative reconstruction -- were routinely implemented in four centers, according to Al Mallah and colleagues. They sought to determine the impact of adopting these techniques on radiation exposure in a study of consecutive patients undergoing CCTA, and they presented their findings at the recent European Society of Cardiology (ESC) Congress in Rome.
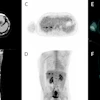
The researchers included 2,919 patients without known coronary artery disease (CAD) from four centers who underwent CCTA to rule out disease between January 2006 and December 2015.
| Acquisition protocol | |
| Scan type | Prospective |
| Rotation time | 0.35 |
| mA | 400 |
| Iterative reconstruction (IR) | 80% |
| kV | 100% |
| Recon kernel | STD |
| Scan field-of-view (SFOV) | Large |
| Slice thickness | 0.625 |
| Body mass index (BMI) | 37 |
| Dose-length product (DLP) | 90 |
The total radiation dose was calculated for each scan from the dose-length product multiplied by the conversion factor (0.014). The annual median radiation doses were compared over the study period.
The group found that after 2010, 47% of the CCTA scans had a radiation dose of less than 2 mSv, while 13% had a dose of less than 1 mSv.
"The adoption of the new techniques was associated with a significant drop in the overall radiation dose for CCTA," Al Mallah noted.
The researchers found no difference in the frequency of nondiagnostic studies or image quality before and after July 2010 (3% versus 1.7%, p = 0.17). There was also a significant reduction in the radiation doses for coronary calcium scores, with the annual median radiation dose falling from 1.82 mSv to 0.43 mSv after 2010 (p < 0.001).

Among the other centers involved in the study were the Prince Sultan Cardiac Center in Qassim, Saudi Arabia, and the cardiology department of Zayed Military Hospital in Abu Dhabi, United Arab Emirates.
The King Abdulaziz Cardiac Center opened in 1999 and is located within the King Abdulaziz Medical City complex in Riyadh. In 2010, the center embarked on a major expansion phase and now provides dedicated facilities for cardiac disease management, outpatient facilities, and additional beds.
The new facility aims to provide quality cardiac care to a rapidly growing population. It operates four catheterization laboratories, four operating rooms, and a growing number of beds and cardiac related support services. The new east wing has three 3,400 m2 floors that include 75 telemetry beds and an enhanced outpatient facility.
At the KACC, the clinics and diagnostic facilities are now fully operational, and nearly half of the beds are in use. The remaining beds will open soon when staffing and other preparations are completed. More than 100 beds are operational, and 45 of these beds are for intensive care, including a medical cardiac intensive care unit (ICU), cardiac surgical ICU, pediatric cardiac ICU, and a coronary care unit.