Dear Advanced Visualization Insider,
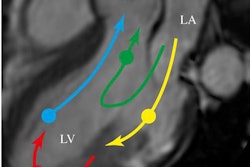
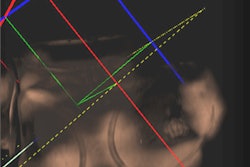
Cardiac MRI is plowing new ground in functional imaging by diagnosing even minor left ventricular dysfunction and displaying the associated flow changes in color. To capture their target, researchers from Sweden used 4D flow MRI in patients with mild ischemia and suspected flow abnormalities to get a closer look at what was going on. They found their technique filled a gap in diagnosing patients who might been left untreated in the past. For the rest of the story, click here.
In the liver, an MRI navigation system with optical instrument tracking is allowing doctors at Leipzig University Hospital to use their regular closed-bore MRI scanner to guide procedures and insert biopsy devices from outside the magnet bore. In the less enlightened times of, say, six months ago, such interventions would have had to be performed on open MRI scanners. Find out how the group did it here.
In CT lung cancer screening, an international team from Switzerland, France, and the U.S. put two separate computer-aided detection (CAD) schemes to the test -- and found that one of them routinely missed an entire class of nodules. What's more, they learned a simple postprocessing technique performed as well as either of the CAD schemes for detecting nodules. Read the intriguing details here.
In breast cancer screening, researchers from the Netherlands built a comprehensive neural network (CNN) to analyze potential breast cancer lesions and determine the most useful image features for predicting the presence of malignancy. And when they put the new network up against a state-of-the-art breast cancer CAD system, they found the CNN outperformed it. Learn how they did it in our feature article.
In what might be the oldest diagnosed example of a malignancy, investigators from South Africa used advanced visualization techniques to evaluate an osteosarcoma in a human ancestor nearly 2 million years old. You can ponder what the research team accomplished by clicking here.
Finally, we invite you to scroll through the links below for the rest of the news about advanced visualization, CAD, 3D printing, and more, right here in your Advanced Visualization Community.


![Overview of the study design. (A) The fully automated deep learning framework was developed to estimate body composition (BC) (defined as subcutaneous adipose tissue [SAT] in liters; visceral adipose tissue [VAT] in liters; skeletal muscle [SM] in liters; SM fat fraction [SMFF] as a percentage; and intramuscular adipose tissue [IMAT] in deciliters) from MRI. The fully automated framework comprised one model (model 1) to quantify different BC measures (SAT, VAT, SM, SMFF, and IMAT) as three-dimensional (3D) measures from whole-body MRI scans. The second model (model 2) was trained to identify standardized anatomic landmarks along the craniocaudal body axis (z coordinate field), which allowed for subdividing the whole-body measures into different subregions typically examined on clinical routine MRI scans (chest, abdomen, and pelvis). (B) BC was quantified from whole-body MRI in over 66,000 individuals from two large population-based cohort studies, the UK Biobank (UKB) (36,317 individuals) and the German National Cohort (NAKO) (30,291 individuals). Bar graphs show age distribution by sex and cohort. BMI = body mass index. (C) After the performance assessment of the fully automated framework, the change in BC measures, distributions, and profiles across age decades were investigated. Age-, sex-, and height-adjusted body composition reference curves were calculated and made publicly available in a web-based z-score calculator (https://circ-ml.github.io).](https://img.auntminnieeurope.com/mindful/smg/workspaces/default/uploads/2026/05/body-comp.XgAjTfPj1W.jpg?auto=format%2Ccompress&dpr=2&fit=crop&h=167&q=70&w=250)


