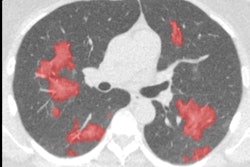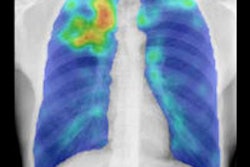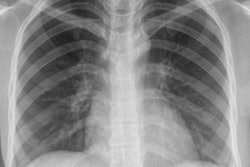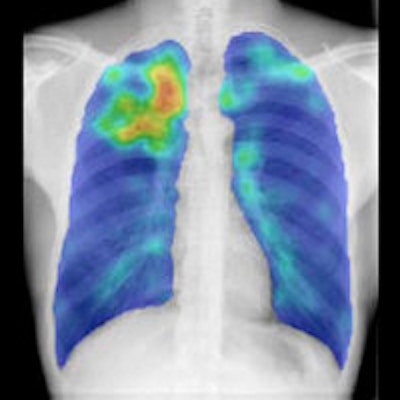
Dutch researchers have developed an algorithm to improve the robustness of computer-aided detection (CAD) to identify tuberculosis (TB) on chest x-rays -- enabling CAD to significantly improve the detection of thoracic abnormalities.
 Rick Philipsen from Radboud University Medical Center.
The team from Radboud University Medical Center in Nijmegen applied an algorithm called an energy normalization process to standardize the appearance of chest radiographs. In their study, the researchers combined the technique with an existing TB CAD scheme to reduce energy variations in 600 radiographs from different x-ray units, allowing CAD to improve the identification of patients with tuberculosis.
Depending on the x-ray machine used for image analysis, the normalization technique as much as doubled the area under the curve (AUC), helping radiologists detect tuberculosis confidently and rule out false positives automatically most of the time.
"Normalization can be used reliably on data from different units and has great potential in TB screening," said Rick Philipsen in a talk at the RSNA 2014 meeting.
Influences on CAD
The performance of CAD systems used in chest radiography can be influenced by several kinds of variations in image data that typically come from different sources, Philipsen said. Different detector technologies, different acquisition settings, proprietary postprocessing techniques, and other factors can all influence the appearance of radiographs, reducing the accuracy of CAD algorithms.
"Therefore, we need another way to deal with this data variation," he said.
Among the possibilities are retraining CAD systems with data from another radiography system, or using a very large CAD training database with data from multiple sources.
Another option is "to normalize or standardize the input prior to analysis, and this is the option that we have chosen," he said. The process begins by decomposing the image in six different frequency bands, putting the highest frequencies on the left and the lowest frequencies on the right.
 To standardize the appearance of chest x-rays, the image is decomposed into frequency bands using a process of hierarchical unsharp masking. In a training set, the average energy or standard deviation of each frequency band in the central part of the image is determined. All bands are then scaled to this reference energy, and the input image is reconstructed from the scaled frequency bands. After energy normalization, the chest radiographs look much more similar to each other. All images courtesy of Rick Philipsen.
The central 70% of energies in each image are selected and the rest are discarded from the image data, according to Philipsen.
"Already that gives us a quite well-normalized image," he said.
Step two of the process is lung segmentation.
"Within that image, we perform a simple and quick lung segmentation, and using this lung segmentation we repeat the normalization process, but taking into account [only] energy normalization in the lungs," he said.
Philipsen, Bram van Ginneken, PhD, and colleagues used chest radiography data to analyze the performance of their in-house CAD system (CAD4TB v3.07, developed by Diagnostic Image Analysis Group, Nijmegen). They evaluated it with and without energy normalization, measuring CAD performance as the area under the receiver operator characteristics (ROC) curve (Az).
The study team trained the CAD system with cases from an Odelca (Rogan-Delft) digital radiography (DR) system. To test for significance, the researchers made pairwise comparisons with bootstrap estimations, with p < 0.05 considered significant.
"The input is the anterior-posterior chest x-ray, and the output is an abnormality score between 0 being normal and 100 being abnormal," Philipsen said. The process was applied to three sets of 200 images each from different sources.
 For the study, the researchers tested the technique with three different x-ray systems that generated 600 cases, nearly evenly split between normal and abnormal as certified by an experienced reader.
 Results showed significant improvement in sensitivity pre- and postnormalization on all three x-ray units. The area under the ROC curve improved from 0.61 to 0.80 on the Atomed DR, from 0.80 to 0.87 on the Odelca DR, and from 0.47 to 0.84 on a Philips Healthcare DR system.
"After normalization, we see all of the Az values increase -- they are all 0.8 now, which is a nice improvement," Philipsen said.
 The application of energy normalization improved CAD's ability to distinguish normal (top row) from abnormal (bottom row) chest radiographs.
Energy normalization works well, improving the robustness of the CAD system for tuberculosis, Philipsen concluded. The process "can be used reliably on data from different x-ray units and has great potential in TB screening," he said.
He also noted that normalization is not limited to digital chest radiography or 2D chest imaging. The process can be applied to CT images and to 3D data from any modality.