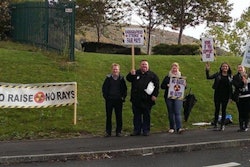
Members of the Society of Radiographers (SoR) in England and Northern Ireland took industrial action on 24 November, as planned.
The radiographers joined members of 10 other unions that have workers in the National Health Service (NHS). They all stopped work from 8 a.m. to noon, and the strike action will be followed by a week of working-to-rule.
This is the second time radiographers followed through with a strike; the first was on 20 October. As before, emergency care was provided, but prebooked appointments and procedures were affected. For the rest of the week, radiographers will take scheduled breaks and will not work unpaid overtime, the society said.
The strike is as a result of a pay freeze, after the government rejected a recommended 1% pay raise for the current year and said there will be no increase in 2015. Settlements were made in Scotland and Wales, so radiographers in those locations did not join the action.
The SoR is making a video of the strike action and has asked members to send the society footage.


![Overview of the study design. (A) The fully automated deep learning framework was developed to estimate body composition (BC) (defined as subcutaneous adipose tissue [SAT] in liters; visceral adipose tissue [VAT] in liters; skeletal muscle [SM] in liters; SM fat fraction [SMFF] as a percentage; and intramuscular adipose tissue [IMAT] in deciliters) from MRI. The fully automated framework comprised one model (model 1) to quantify different BC measures (SAT, VAT, SM, SMFF, and IMAT) as three-dimensional (3D) measures from whole-body MRI scans. The second model (model 2) was trained to identify standardized anatomic landmarks along the craniocaudal body axis (z coordinate field), which allowed for subdividing the whole-body measures into different subregions typically examined on clinical routine MRI scans (chest, abdomen, and pelvis). (B) BC was quantified from whole-body MRI in over 66,000 individuals from two large population-based cohort studies, the UK Biobank (UKB) (36,317 individuals) and the German National Cohort (NAKO) (30,291 individuals). Bar graphs show age distribution by sex and cohort. BMI = body mass index. (C) After the performance assessment of the fully automated framework, the change in BC measures, distributions, and profiles across age decades were investigated. Age-, sex-, and height-adjusted body composition reference curves were calculated and made publicly available in a web-based z-score calculator (https://circ-ml.github.io).](https://img.auntminnieeurope.com/mindful/smg/workspaces/default/uploads/2026/05/body-comp.XgAjTfPj1W.jpg?auto=format%2Ccompress&fit=crop&h=112&q=70&w=112)


