German medical imaging software developer MeVis Medical Solutions reported flat revenue growth and a slight increase in earnings in its second quarter of 2014.
For the quarter (end-30 June), the vendor had sales of 3.2 million euros, which is the same as last year. While sales in the digital mammography segment increased by 7% to 4.7 million euros, sales in the "other diagnostics" segment fell by 23% to 1.3 million euros. Net profit for the period was 1.7 million euros, compared with 1.6 million euros in the same period last year.
However, the 6.1 million euros in sales in the first half of the year were marginally lower than the 6.2 million euros reported in the first half of 2013. The company is now forecasting that sales for current fiscal year will range between 12 million and 12.5 million euros, a slight decline from 2013. Earnings before interest and taxes (EBIT) are anticipated to reach 3.0 million to 3.5 million euros, impacted significantly by the forecasted sales decline and a marginal increase in costs.
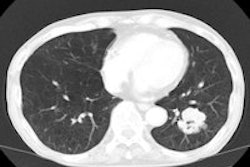
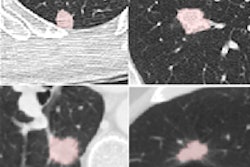
MeVis is expanding its product portfolio to reduce dependency on the digital mammography segment, CEO Marcus Kirchhoff noted in a statement. In particular, MeVis has begun developing its own software for lung cancer screening in close cooperation with the University of Nijmegen in the Netherlands. MeVis expects to complete the software in the third quarter of 2014.


![Overview of the study design. (A) The fully automated deep learning framework was developed to estimate body composition (BC) (defined as subcutaneous adipose tissue [SAT] in liters; visceral adipose tissue [VAT] in liters; skeletal muscle [SM] in liters; SM fat fraction [SMFF] as a percentage; and intramuscular adipose tissue [IMAT] in deciliters) from MRI. The fully automated framework comprised one model (model 1) to quantify different BC measures (SAT, VAT, SM, SMFF, and IMAT) as three-dimensional (3D) measures from whole-body MRI scans. The second model (model 2) was trained to identify standardized anatomic landmarks along the craniocaudal body axis (z coordinate field), which allowed for subdividing the whole-body measures into different subregions typically examined on clinical routine MRI scans (chest, abdomen, and pelvis). (B) BC was quantified from whole-body MRI in over 66,000 individuals from two large population-based cohort studies, the UK Biobank (UKB) (36,317 individuals) and the German National Cohort (NAKO) (30,291 individuals). Bar graphs show age distribution by sex and cohort. BMI = body mass index. (C) After the performance assessment of the fully automated framework, the change in BC measures, distributions, and profiles across age decades were investigated. Age-, sex-, and height-adjusted body composition reference curves were calculated and made publicly available in a web-based z-score calculator (https://circ-ml.github.io).](https://img.auntminnieeurope.com/mindful/smg/workspaces/default/uploads/2026/05/body-comp.XgAjTfPj1W.jpg?auto=format%2Ccompress&fit=crop&h=112&q=70&w=112)


