GE Healthcare is collaborating with Tesla Engineering of West Sussex, U.K., on the production of 7-tesla MRI magnets.
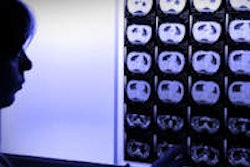
The ultrahigh-field magnets will be used in MRI scanners to explore conditions ranging from cancer and amyotrophic lateral sclerosis (ALS) to brain trauma, epilepsy, and autism.
GE has installed a Discovery MR 950 7-tesla scanner at the Imago7 Research Foundation in Italy under the direction of Dr. Michela Tosetti. The researchers have been using the scanner to look for markers of neurodegenerative diseases and to study epilepsy, and they also plan to examine pediatric brain tumors. The scanner is still an investigational device and is not yet cleared by the U.S. Food and Drug Administration (FDA).
In an article published by the company, GE asserted that the magnet is almost as strong as the 8-tesla magnets guiding beams of high-energy particles inside the European Council for Nuclear Research's Large Hadron Collider in Geneva.
Baldev Ahluwalia, GE's MR manager, said the 7-tesla scanner could also help the company's engineers and their research collaborators optimize existing 1.5- and 3-tesla scanners.


![Overview of the study design. (A) The fully automated deep learning framework was developed to estimate body composition (BC) (defined as subcutaneous adipose tissue [SAT] in liters; visceral adipose tissue [VAT] in liters; skeletal muscle [SM] in liters; SM fat fraction [SMFF] as a percentage; and intramuscular adipose tissue [IMAT] in deciliters) from MRI. The fully automated framework comprised one model (model 1) to quantify different BC measures (SAT, VAT, SM, SMFF, and IMAT) as three-dimensional (3D) measures from whole-body MRI scans. The second model (model 2) was trained to identify standardized anatomic landmarks along the craniocaudal body axis (z coordinate field), which allowed for subdividing the whole-body measures into different subregions typically examined on clinical routine MRI scans (chest, abdomen, and pelvis). (B) BC was quantified from whole-body MRI in over 66,000 individuals from two large population-based cohort studies, the UK Biobank (UKB) (36,317 individuals) and the German National Cohort (NAKO) (30,291 individuals). Bar graphs show age distribution by sex and cohort. BMI = body mass index. (C) After the performance assessment of the fully automated framework, the change in BC measures, distributions, and profiles across age decades were investigated. Age-, sex-, and height-adjusted body composition reference curves were calculated and made publicly available in a web-based z-score calculator (https://circ-ml.github.io).](https://img.auntminnieeurope.com/mindful/smg/workspaces/default/uploads/2026/05/body-comp.XgAjTfPj1W.jpg?auto=format%2Ccompress&fit=crop&h=112&q=70&w=112)


