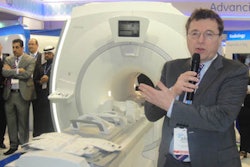
Medical software developer Blackford Analysis introduced its software to the Middle Eastern market at this week's Arab Health meeting in Dubai, United Arab Emirates.
The company's software works within existing applications such as PACS or image viewers to allow users to compare multiple image studies with a single click, the firm said.
In particular, Blackford Analysis is featuring the following applications:
- MatchedCrosshairs, which enhances any image viewer to allow users to click once on a location in any scan to find the same location in multiple scans from different time points and/or different modalities (CT, MRI, or PET)
- MatchedView, which allows any image viewer to compensate for changes in patient position and acquisition planes between scans, automatically presenting views of compared exams in the same position and plane and enabling like-for-like comparison
- AutoSync, which gives image viewers the ability to perform slice synchronization across exams automatically, regardless of differences in acquisition protocol and patient positioning, so reading can start immediately when compared exams are displayed
- Fusion, which allows image viewers to display accurate anatomical location of functional imaging findings by displaying fused views of exams from the same, hybrid, or complementary modalities


![Overview of the study design. (A) The fully automated deep learning framework was developed to estimate body composition (BC) (defined as subcutaneous adipose tissue [SAT] in liters; visceral adipose tissue [VAT] in liters; skeletal muscle [SM] in liters; SM fat fraction [SMFF] as a percentage; and intramuscular adipose tissue [IMAT] in deciliters) from MRI. The fully automated framework comprised one model (model 1) to quantify different BC measures (SAT, VAT, SM, SMFF, and IMAT) as three-dimensional (3D) measures from whole-body MRI scans. The second model (model 2) was trained to identify standardized anatomic landmarks along the craniocaudal body axis (z coordinate field), which allowed for subdividing the whole-body measures into different subregions typically examined on clinical routine MRI scans (chest, abdomen, and pelvis). (B) BC was quantified from whole-body MRI in over 66,000 individuals from two large population-based cohort studies, the UK Biobank (UKB) (36,317 individuals) and the German National Cohort (NAKO) (30,291 individuals). Bar graphs show age distribution by sex and cohort. BMI = body mass index. (C) After the performance assessment of the fully automated framework, the change in BC measures, distributions, and profiles across age decades were investigated. Age-, sex-, and height-adjusted body composition reference curves were calculated and made publicly available in a web-based z-score calculator (https://circ-ml.github.io).](https://img.auntminnieeurope.com/mindful/smg/workspaces/default/uploads/2026/05/body-comp.XgAjTfPj1W.jpg?auto=format%2Ccompress&fit=crop&h=112&q=70&w=112)


