Growing use of hypofractionation in clinical practice and its link to increased treatment resistance due to tumor cell hypoxia means that it may be beneficial to visualize and quantify hypoxic areas with PET imaging to monitor changes in tumor metabolism during treatment.
Hypoxia can increase the resistance of tumor cells to radiotherapy, as has been shown in head, neck, and lung cancers. Speaking at last week's European Society of Therapeutic Radiology and Oncology (ESTRO) meeting in London, Dr. Jan Bussink, from the department of radiation oncology at Radboud University Medical Center in Nijmegen, the Netherlands, discussed the need to monitor early response and target hypoxic tumor cells when using hypofractionation.
"Almost 90% of solid tumors contain hypoxic cells and they are clearly present in lung tumors. They are very resistant in conventional fractionated radiotherapy," he said. "One of the main advantages of PET is the potential to monitor tumor metabolism during treatment. This allows us to prospectively assess changes in the tumor microenvironment that are not visible on CT."
 There is a need to monitor early response and target hypoxic tumor cells when using hypofractionation, according to Dr. Jan Bussink.
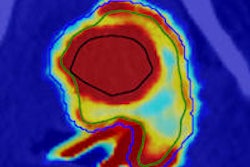
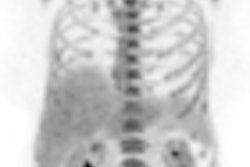
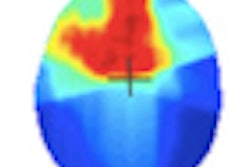
Several PET tracers are available for hypoxia imaging. These tracers are mainly 2-nitroimidazole derivatives, such as F-18 fluoromisonidazole (FMISO). Bussink reported that if lung cancer patients are selected for hypoxia before radiotherapy, using a noninvasive F-18 FMISO scan, treatment response might improve.
"If hypoxic tumors are treated with chemoradiotherapy without modification for hypoxia, then they are very poorly controlled, compared to if modification is used. This may be a way to move forward, especially in preselection of patients who fail stereotactic body radiotherapy," he said.
Bussink illustrated his point by referring to radiotherapy of an adenocarcinoma tumor line with a single dose of 20 Gy. Initially, there's a strong reduction in hypoxia, but then within 28 hours, the marker shows that proliferation recommences within one day after treatment, he said.
Other studies have shown that if hypoxia is factored into a model of fractionated radiotherapy, then results of cell kill resemble the reality seen in clinical trial results. In the study by Brown, tumors with 20% hypoxia receiving three fractions of 60 Gy showed a cell kill of 7.7 logs compared with 27.4 logs of cell kill without hypoxia. It is very likely that hypoxia plays a role in hypofractionation in these tumors, Bussink reported.
"It is likely that high doses of radiotherapy cause substantial side effects, even in the best conformal plans for stereotactic lung cancer fractionation schedules adapted to tumor location," he said, adding that there was a case for preimaging of hypoxia and modification of the oxygenation status in the case of hypoxia. This could play a role in around 50% of lung tumors.
Dr. JohannesKaanders, from the University of Nijmegen in the Netherlands, commented on the importance of tracing and allowing for hypoxia in radiotherapy of head, neck, and lung cancers.
"The effect of a few high doses [of hypofractionation] on hypoxia is very different to the effect in more multifractionated radiotherapy. This opens a new era for hypoxic sensitizers. There'll be much better effect on hypoxic tumors when a hypofractionated schedule is used," he said.
Monitoring early response when using highly effective but toxic regimens such as hypofractionated radiotherapy probably necessitates earlier scanning, Bussink concluded. He added that using F-18 FMISO has predictive value because by specifically targeting hypoxic tumor cells, it results in fewer recurrent tumors. However, there is an urgent need for hypofractionated sensitizer radiotherapy trials.