A tech spin-off from the University of Sussex called TexRad has launched new software that produces prognostic information using diagnostic images.
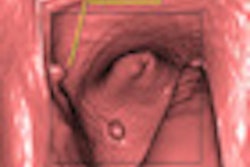
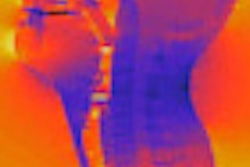
The software derives "textures" from diagnostic images, and highlights anomalies not seen with the human eye. Using the anomalies, the software generates a risk stratification report that can also be used retrospectively.
TexRad can analyze CT images of colorectal, lung, renal, prostate, and esophageal cancers, as well as mammograms.
TexRad may be able to predict early response to treatment, prognosis, and tissue characterization. Doing so allows clinicians to modify treatment early and improve patient outcomes, according to TexRad's creator, Balaji Ganeshan, PhD, a research fellow at the Brighton and Sussex Medical School at the University of Sussex.
Clinical settings in the U.K., Denmark, the U.S., and Italy are evaluating the software to enhance development and clinical usability, according to TexRad.


![Overview of the study design. (A) The fully automated deep learning framework was developed to estimate body composition (BC) (defined as subcutaneous adipose tissue [SAT] in liters; visceral adipose tissue [VAT] in liters; skeletal muscle [SM] in liters; SM fat fraction [SMFF] as a percentage; and intramuscular adipose tissue [IMAT] in deciliters) from MRI. The fully automated framework comprised one model (model 1) to quantify different BC measures (SAT, VAT, SM, SMFF, and IMAT) as three-dimensional (3D) measures from whole-body MRI scans. The second model (model 2) was trained to identify standardized anatomic landmarks along the craniocaudal body axis (z coordinate field), which allowed for subdividing the whole-body measures into different subregions typically examined on clinical routine MRI scans (chest, abdomen, and pelvis). (B) BC was quantified from whole-body MRI in over 66,000 individuals from two large population-based cohort studies, the UK Biobank (UKB) (36,317 individuals) and the German National Cohort (NAKO) (30,291 individuals). Bar graphs show age distribution by sex and cohort. BMI = body mass index. (C) After the performance assessment of the fully automated framework, the change in BC measures, distributions, and profiles across age decades were investigated. Age-, sex-, and height-adjusted body composition reference curves were calculated and made publicly available in a web-based z-score calculator (https://circ-ml.github.io).](https://img.auntminnieeurope.com/mindful/smg/workspaces/default/uploads/2026/05/body-comp.XgAjTfPj1W.jpg?auto=format%2Ccompress&fit=crop&h=112&q=70&w=112)


