TomTec Imaging Systems of Munich, Germany, is planning to enter the market for cardiology PACS software with the launch of a product called CardioArena later this year.
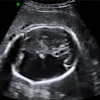
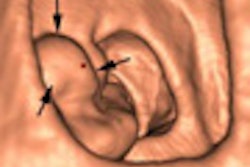
CardioArena is designed for the review of 2D, 3D, and 4D image data, and supports multiple modalities, including ultrasound, MRI, and catheterization labs. The software can be added to existing PACS and cardiac PACS networks, and tailored to facilities ranging in size from private offices to hospitals, the company said.
Related Reading
Toshiba, TomTec to partner on cardiac 4D ultrasound, December 6, 2007
TomTec to expand into MRI, March 21, 2007
TomTec management, staff acquire 100% of company, June 6, 2006
TomTec debuts 4D RV-Function, June 1, 2006
TomTec debuts 4D LV-Function, April 19, 2006
Copyright © 2008 AuntMinnie.com


![Overview of the study design. (A) The fully automated deep learning framework was developed to estimate body composition (BC) (defined as subcutaneous adipose tissue [SAT] in liters; visceral adipose tissue [VAT] in liters; skeletal muscle [SM] in liters; SM fat fraction [SMFF] as a percentage; and intramuscular adipose tissue [IMAT] in deciliters) from MRI. The fully automated framework comprised one model (model 1) to quantify different BC measures (SAT, VAT, SM, SMFF, and IMAT) as three-dimensional (3D) measures from whole-body MRI scans. The second model (model 2) was trained to identify standardized anatomic landmarks along the craniocaudal body axis (z coordinate field), which allowed for subdividing the whole-body measures into different subregions typically examined on clinical routine MRI scans (chest, abdomen, and pelvis). (B) BC was quantified from whole-body MRI in over 66,000 individuals from two large population-based cohort studies, the UK Biobank (UKB) (36,317 individuals) and the German National Cohort (NAKO) (30,291 individuals). Bar graphs show age distribution by sex and cohort. BMI = body mass index. (C) After the performance assessment of the fully automated framework, the change in BC measures, distributions, and profiles across age decades were investigated. Age-, sex-, and height-adjusted body composition reference curves were calculated and made publicly available in a web-based z-score calculator (https://circ-ml.github.io).](https://img.auntminnieeurope.com/mindful/smg/workspaces/default/uploads/2026/05/body-comp.XgAjTfPj1W.jpg?auto=format%2Ccompress&fit=crop&h=112&q=70&w=112)


