Coronary CT angiography (CTA) with prospective electrocardiogram gating allows accurate evaluation of coronary artery disease with significantly less radiation dose than conventional invasive angiography, according to a study from the German Heart Center in Munich.
The study examined 42 patients who were referred for elective invasive angiography due to suspected coronary artery disease. They elected to undergo low-dose coronary CTA following IV contrast administration and without calcium scoring the same day before angiography (Heart, October 2009, Vol. 95:20, pp. 1656-1661).
Dose-area product of angiography and coronary CTA were measured, converted into effective radiation doses, and compared along with the accuracy of the two techniques for detecting clinically significant stenoses (≥ 50%).
Researchers found that coronary CTA with prospective electrocardiogram gating delivered an estimated mean effective radiation dose of 2.1 ± 0.7 mSv (range, 1.0-3.3), compared to 8.5 ± 4.4 mSv (range, 1.4-20.5) for angiography.
CTA cleared 19 patients (42.9%) of coronary artery disease, and another 40 (95.2%) were correctly classified as having significant disease (23/23) or no disease (17/19).
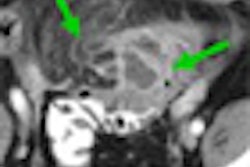
How good was image quality with prospective gating? More than 97% (551/567) of segments were evaluable based on the 17-segment American Heart Association model. Compared to the reference standard of conventional angiography, the sensitivity, specificity, and positive and negative predictive values were 94.2% (confidence interval [CI]: 0.8-1.0), 94.8% (CI: 09-1.0), 89.0% (CI: 0.8-1.0), and 97.4% (CI: 09-1.0), respectively, with accuracy of 94.6%.
Calling the paper a first comparison of the two techniques, lead author Dr. Bernard Herzog and colleagues concluded that "our results not only confirm the feasibility and reliability (accuracy versus invasive coronary angiography) of this low-dose ... protocol but also show that [effective dose] is significantly lower by about 75% than in coronary angiography," they wrote. "This holds true for each individual patient and independently from body mass index and was not subject to a large interindividual variability," in contrast to the high variability of the angiography results.
Related Reading
Cardiac CT matches SPECT for perfusion analysis, September 17, 2009
Negative CCTA clears chest pain patients for 3 years, inexpensively, August 26, 2009
Coronary CTA beats calcium scoring for short-term prognosis, August 14, 2009
Study correlates CTA to angiography, myocardial perfusion SPECT, May 25, 2007
Stress MPI with Tc-99m SPECT identifies high-risk obese patients, September 1, 2006
Copyright © 2009 AuntMinnie.com


![Overview of the study design. (A) The fully automated deep learning framework was developed to estimate body composition (BC) (defined as subcutaneous adipose tissue [SAT] in liters; visceral adipose tissue [VAT] in liters; skeletal muscle [SM] in liters; SM fat fraction [SMFF] as a percentage; and intramuscular adipose tissue [IMAT] in deciliters) from MRI. The fully automated framework comprised one model (model 1) to quantify different BC measures (SAT, VAT, SM, SMFF, and IMAT) as three-dimensional (3D) measures from whole-body MRI scans. The second model (model 2) was trained to identify standardized anatomic landmarks along the craniocaudal body axis (z coordinate field), which allowed for subdividing the whole-body measures into different subregions typically examined on clinical routine MRI scans (chest, abdomen, and pelvis). (B) BC was quantified from whole-body MRI in over 66,000 individuals from two large population-based cohort studies, the UK Biobank (UKB) (36,317 individuals) and the German National Cohort (NAKO) (30,291 individuals). Bar graphs show age distribution by sex and cohort. BMI = body mass index. (C) After the performance assessment of the fully automated framework, the change in BC measures, distributions, and profiles across age decades were investigated. Age-, sex-, and height-adjusted body composition reference curves were calculated and made publicly available in a web-based z-score calculator (https://circ-ml.github.io).](https://img.auntminnieeurope.com/mindful/smg/workspaces/default/uploads/2026/05/body-comp.XgAjTfPj1W.jpg?auto=format%2Ccompress&dpr=2&fit=crop&h=167&q=70&w=250)


